Blog / 2010

Bible Cross References Visualization

Here’s a visualization of 340,000 Bible cross references:
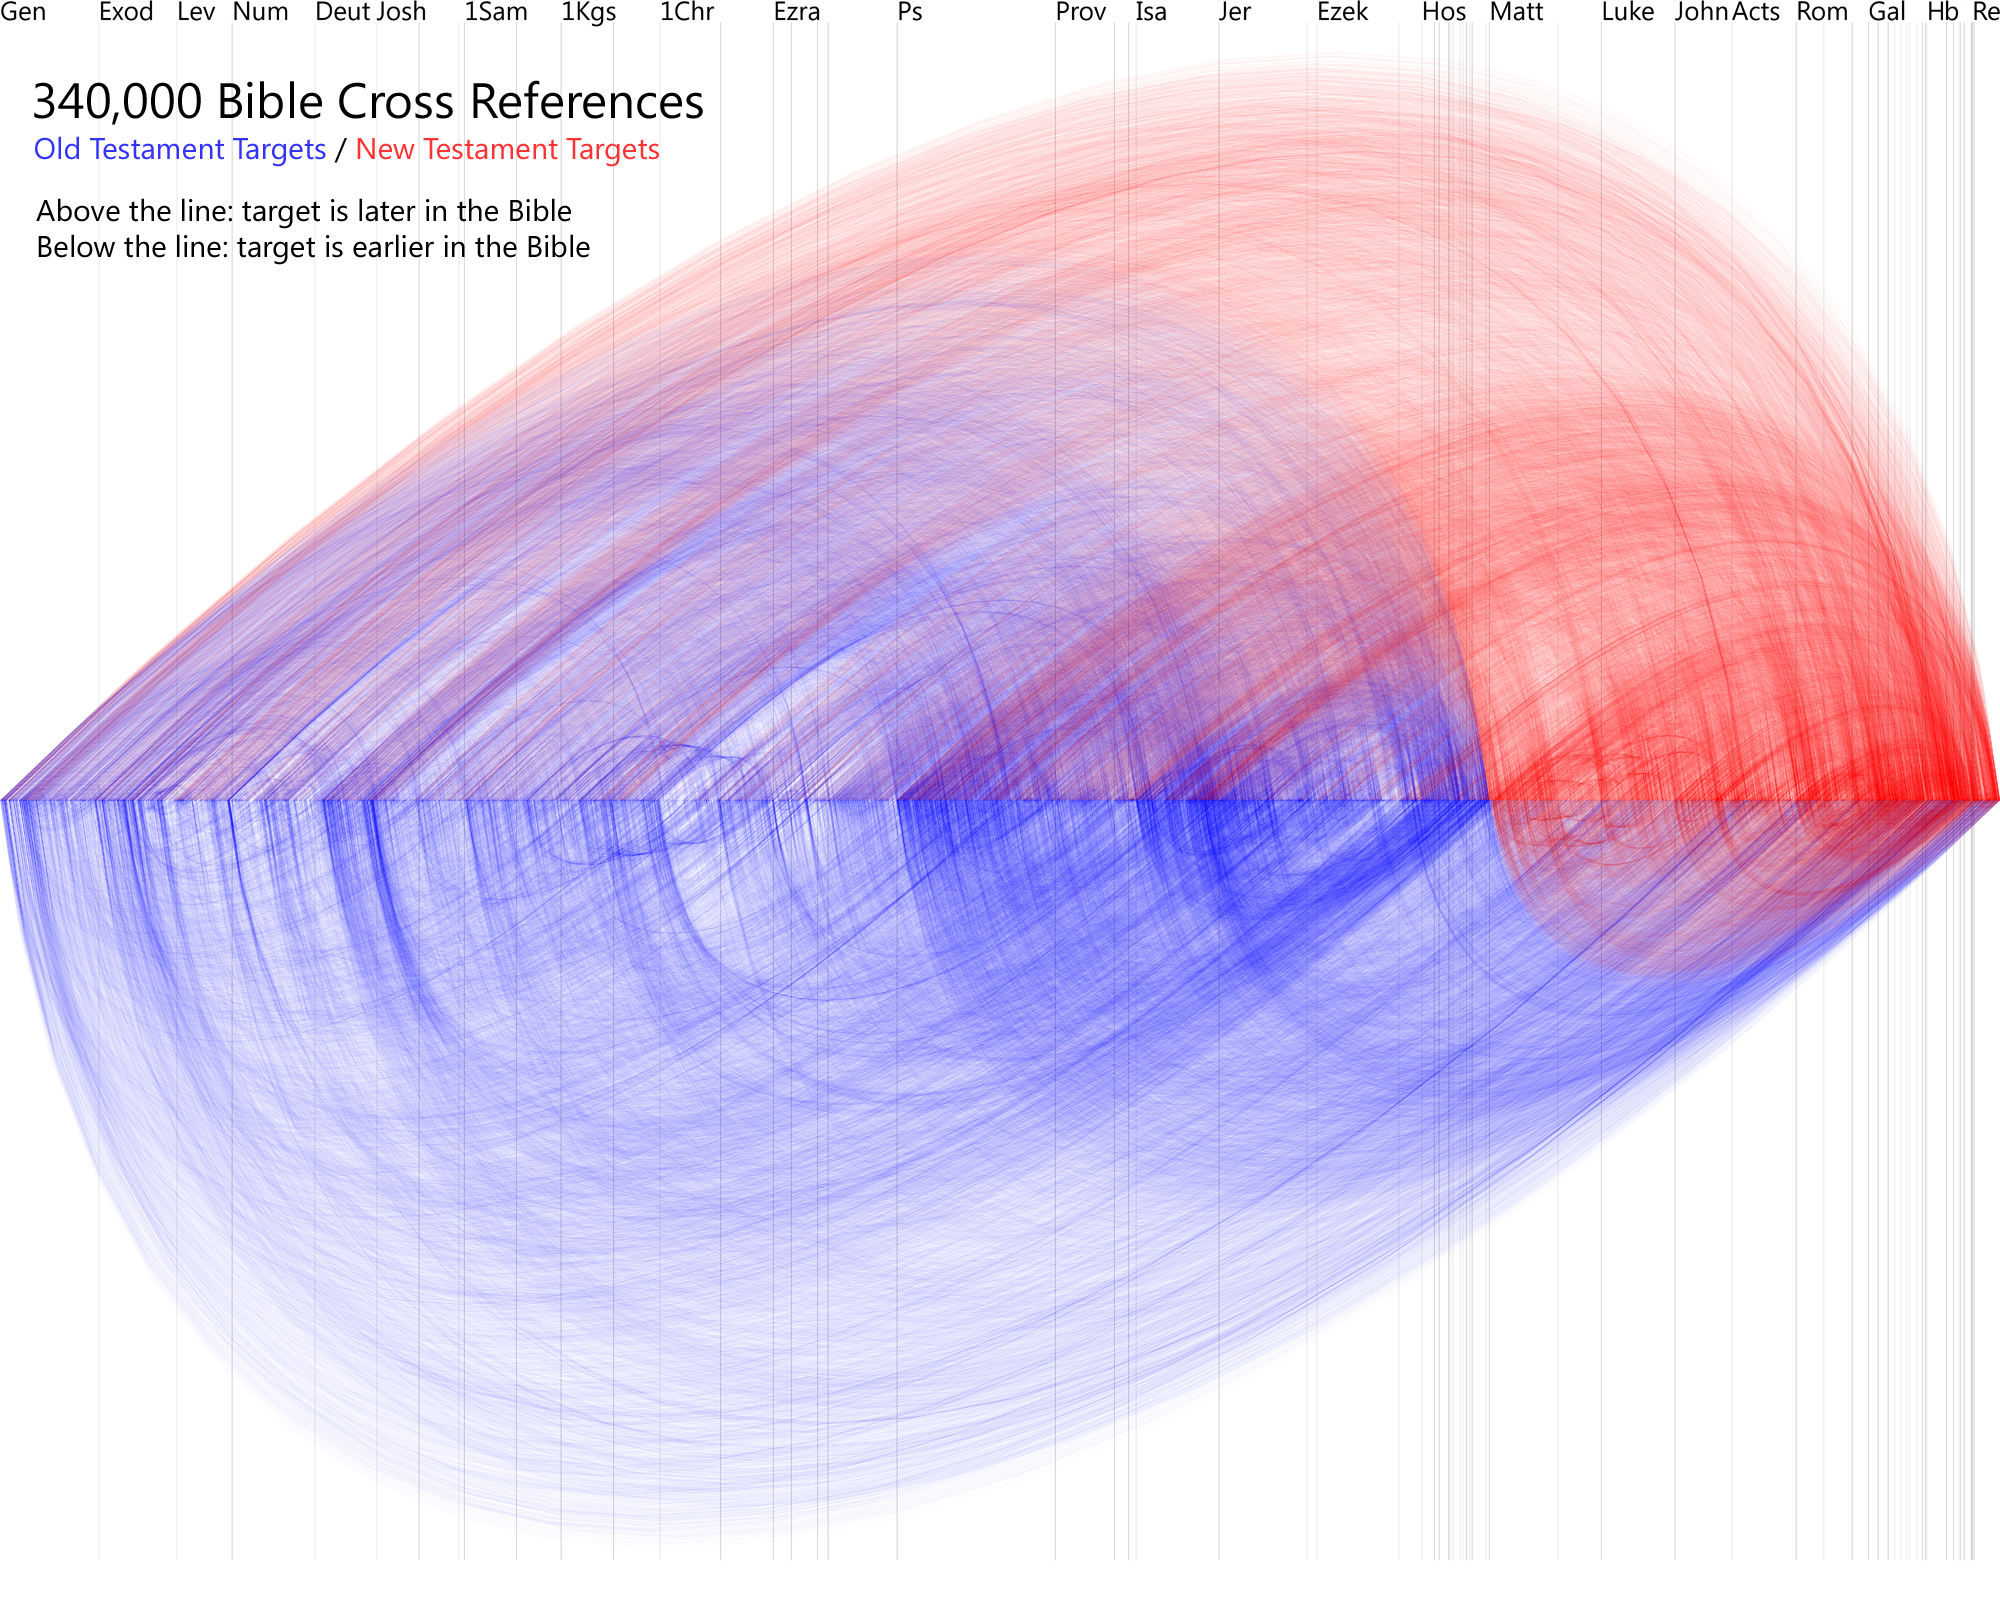
Visualization of Bible cross references. Larger version (2,000 x 1,600 pixels).

Does anything strike you as intriguing? A few trends jump out at me:

  1. The frequency of dense New Testament streaks in the Old Testament, especially in Leviticus and Deuteronomy; I didn't expect to see them there.
  2. The loops in Samuel / Kings / Chronicles and in the Gospels indicating parallel stories.
  3. The sudden increased density of New Testament references in Psalms through Isaiah.
  4. The eschatological references in Isaiah and Daniel.
  5. The density of references from the Minor Prophets back to both the Major Prophets and earlier in the Old Testament.
  6. The surprising density of cross references in Hebrew-Jude.
  7. The asymmetry. If verse A cites verse B, verse B doesn't necessarily cite verse A. I wonder if I should make the data symmetrical.

You can also download the full-size image (10,000 x 8,000 pixels, 75 MB PNG). It’s a very large image that could crash your browser. If you want it, I strongly recommend that you save it to your computer rather than trying to open it in your browser.

This visualization uses data from the Bible Cross References project. I used PHP’s GD library to create the graphic.

Inspired by Chris Harrison and Christian Swinehart’s wonderful Choose Your Own Adventure work.
Posted in Cross References, Visualizations

New in Labs: Cross References

Browse 340,000 Bible cross references. Make the list better by voting on relevant or irrelevant verses.

For example, try Philippians 4:13 (“I can do all things through Christ who strengthens me”) or Isaiah 40:31 (“They shall mount up on wings like eagles”).

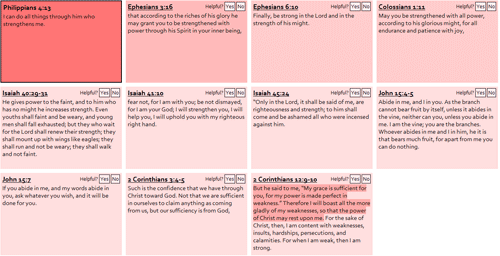
Philippians 4:13 cross references

The interface is about as bare-bones as it gets: there’s a list of cross references for a single Bible verse, sorted by relevance (i.e., votes). You can browse to related verses, vote on whether each cross reference is relevant, and see (on external sites) the verses in different translations. It also prints nicely. There’s no way to suggest new cross references, though I may add that feature if there’s demand.

The data comes primarily from The Treasury of Scripture Knowledge (TSK) but blends other data, including the Topical Bible and Twitter Bible Search. All the copies of TSK on the web seem to descend from one source; I did some basic cleaning of the data and extracted the references. Then I blended the other data to weight some cross references more highly than others—that’s where the initial vote counts come from. (Incidentally, I only count around 380,000 cross references in TSK, lower than the usual count of 500,000 cross references you find when people talk about TSK. The lower number of cross references on this site–340,000–comes mostly from removing duplicates and combining adjacent verses.)

The 340,000 cross references in this data are a substantial number–most cross reference systems in print Bibles contain 50,000-100,000 cross references. While this list is more comprehensive, the tradeoff is that some of the cross references are less relevant than you find in print Bibles. As people use this site, however, the most-relevant verses should rise to the top.

The main limitation to the data is that the cross references always point from a single verse rather than from a range of verses: in other words, from Matthew 5:3 instead of from Matthew 5:3-11. Broader cross references—references that apply to a complete passage—are therefore missing from the data, limiting its usefulness somewhat.

The lack of an open, high-quality source of Bible cross references on the web has always bewildered me. This project is an attempt to remedy that deficiency. Feel free to download the raw cross-reference data (2 MB .zip, updated regularly with the latest vote counts) and use it in your projects.

Update April 12, 2010: Fred Sanders at Scriptorium Daily has a great introduction to the Treasury of Scripture Knowledge if you want more background on this work.

Posted in Cross References

Presentation on Tweeting the Bible

Here’s a presentation I just gave at the BibleTech 2010 conference about how people tweet the Bible:

Also: PowerPoint, PDF.

I distributed the following handout at the presentation, showing the popularity of Bible chapters and verses cited on Twitter. It displays a lot of data: darker chapters are more popular, the number in the middle of each box is the most popular verse in the chapter, and sparklines in each box show the distribution of the popularity in each chapter. (Genesis 1:1 is by far the most popular verse in Genesis 1, while Genesis 3:15 is only a little more popular than other verses in the chapter.)

The grid shows the popularity of chapters and verses in the Bible as cited on Twitter.

Posted in Bible, Twitter, Visualizations

Delving into Lent Data

Let’s look a little more at some of the data on what Twitterers are giving up for Lent.

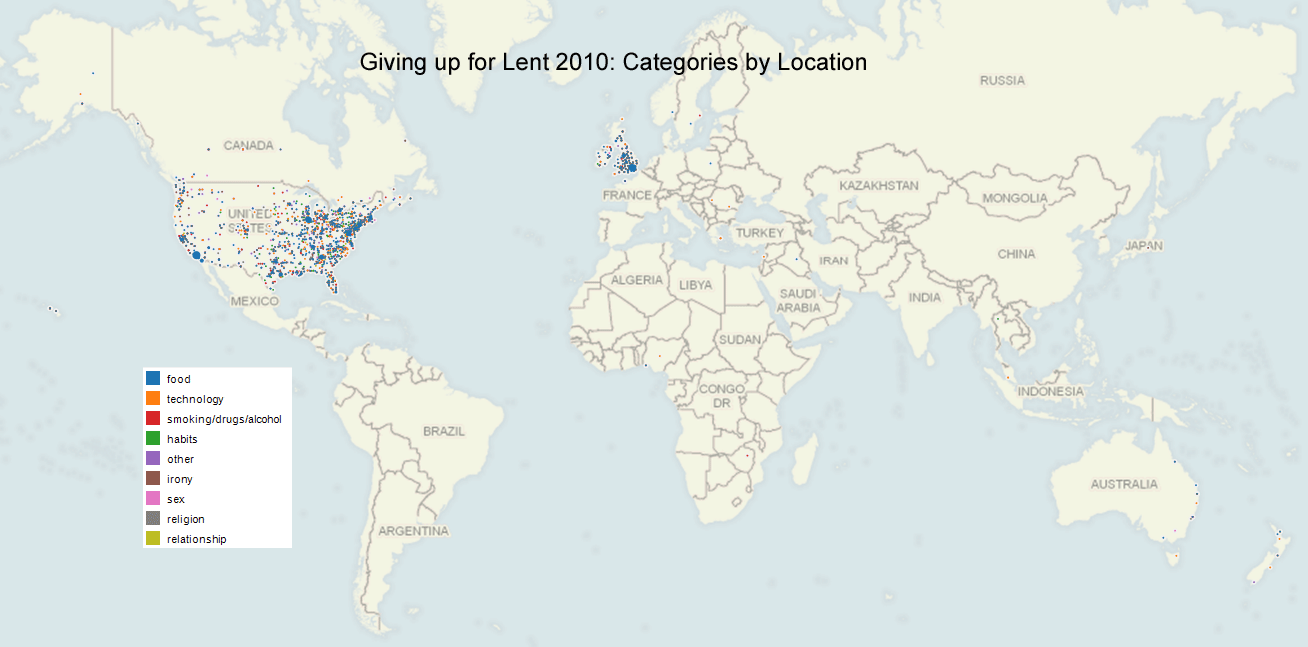
Categories of Things Given up by Location

As I only track in English what people are giving up, there are concentrations in English-speaking countries.

Categories by Country Size indicates the relative number of Twitterers in each country giving up something for Lent.

Categories by Location

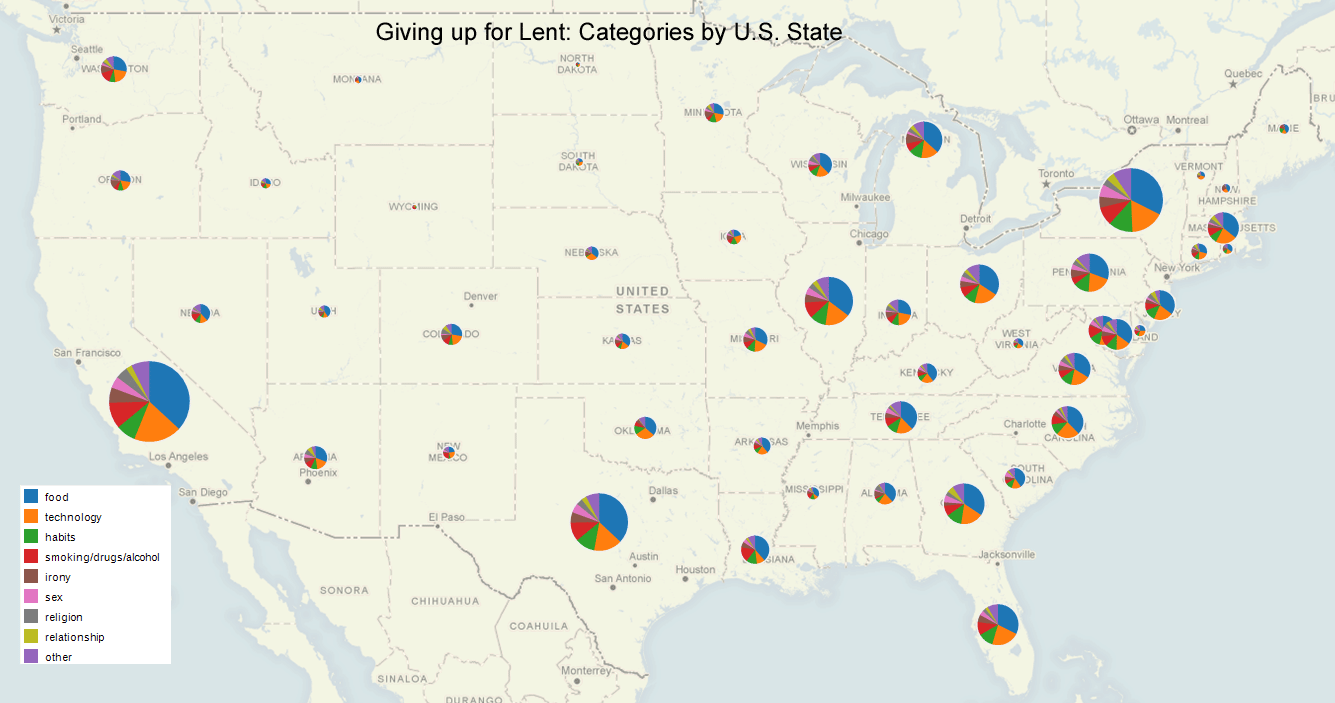
Categories of Things Given up by State

These visualizations show the differences (or lack thereof) in what people are giving up among U.S. states.

Categories by State Size indicates the relative number of Twitterers in each state giving up something for Lent. Sorry, Alaska and Hawaii.

Categories by State (%) The composition of each state’s categories of tweets shows mostly minor variations among states. Some states (like Wyoming on the far right) have small numbers of tweets. I would have liked to use opacity or width to indicate this disparity but couldn’t figure out how to do it.

Comparison between 2009 and 2010

This treemap shows how the data changed between 2009 and 2010. The size of the box shows the number of people giving up each category and thing, while color indicates the percentage change from last year: dark blue indicates the steepest drop; dark orange indicates the steepest rise. The second chart shows the same data more conventionally expressed.

Categories and Terms: Term Changes: 2009-2010

Categories and Terms: Term Changes: 2009-2010

About the Visualizations

I created these charts mostly to explore how the new data-analysis software Tableau Public works. One of its claims to fame is that you can publish interactive visualizations to the web, a feature I didn’t take advantage of here. Tableau doesn’t do treemaps, so I used Many Eyes to create the treemap; the closest Tableau equivalent appears below the treemap.

Posted in Lent, Twitter, Visualizations

What Twitterers Are Giving up for Lent (2010 Edition)

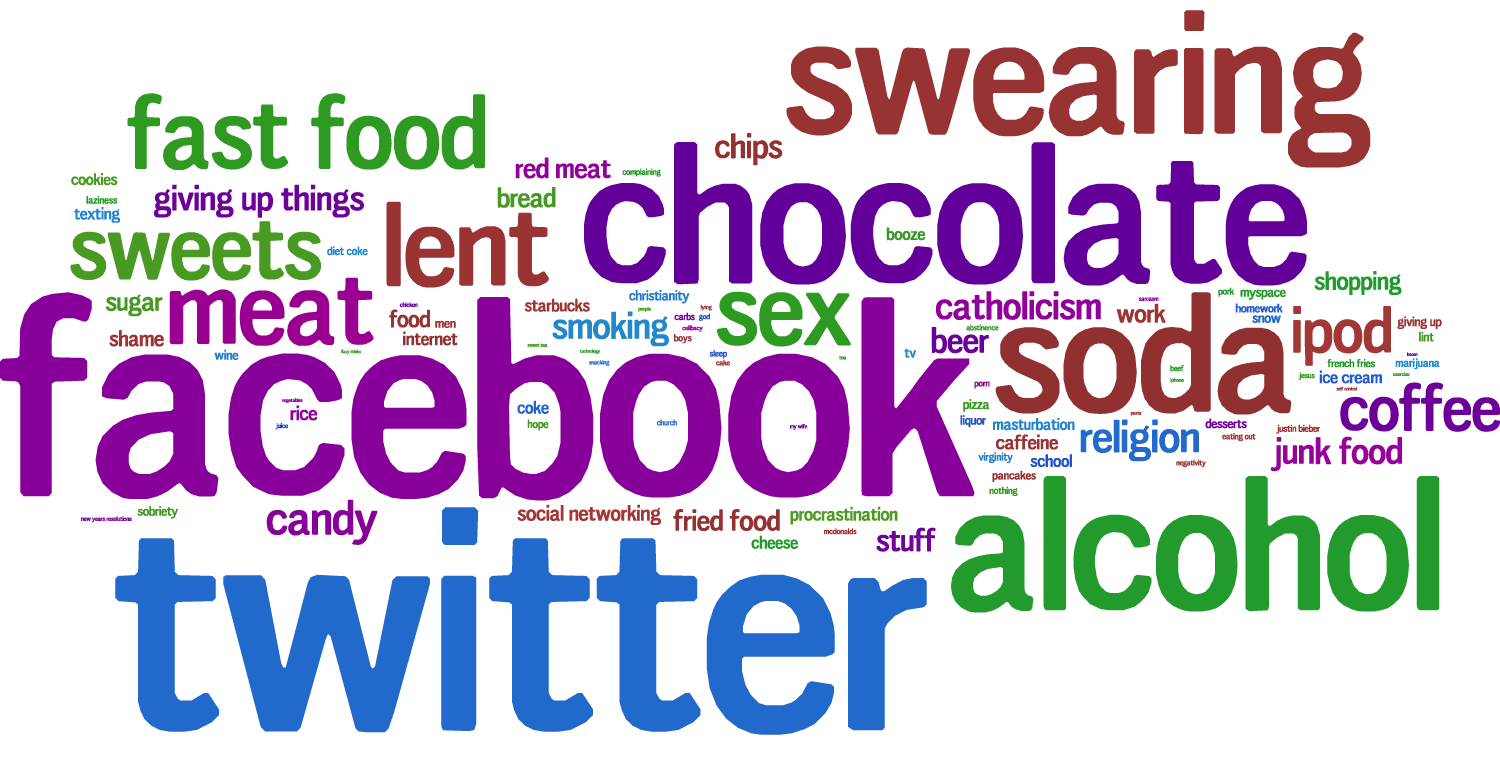
The top 100 things that Twitterers are giving up for Lent in 2010.

Snow makes the list this year, understandable given the Snowpocalypse and Snowmageddon that gripped much of the Eastern U.S. in the weeks preceding Ash Wednesday. IPods also made the list after the Bishop of Liverpool asked people to consider praying instead of listening to them. This year a celebrity, Justin Bieber, cracks the top 100. He beat out the Jonas Brothers, 64 votes to 11; draw your own conclusions.

The list largely tracks last year’s list. It draws from 40,000 tweets retrieved February 14-20, 2010.

Complete List of the Top 100

RankWordCountChange from last year's rank
1.Twitter2089+1
2.Facebook1874-1
3.Chocolate13230
4.Alcohol1258+1
5.Swearing1158+5
6.Soda11260
7.Lent792-3
8.Meat7200
9.Sex701+7
10.Fast food695+7
11.Sweets6270
12.Coffee445-5
13.iPod437 
14.Candy325+18
15.Religion305-6
16.Catholicism264-4
17.Smoking254+5
18.Junk food251+34
19.Giving up things241-6
20.Beer241-5
21.Chips234+24
22.You233+13
23.Stuff217-3
24.Fried food199+33
25.Red meat193+19
26.Bread187+13
27.Sugar183-8
28.Work176-14
29.Shopping174+11
30.Food162-7
31.Shame150 
32.Social networking147-2
33.Caffeine136-6
34.Rice136+44
35.Procrastination127-11
36.Internet126-11
37.Cheese120+1
38.Coke120+41
39.Starbucks119+14
40.School118+36
41.Ice cream118+13
42.Booze117-21
43.Texting114+28
44.Masturbation111 
45.Cookies110+11
46.TV97-18
47.Christianity960
48.Snow96 
49.Wine92-13
50.Pizza91+12
51.MySpace91+4
52.Men90+31
53.Giving up89-19
54.Sobriety89-13
55.Liquor87 
56.Desserts87 
57.Lint87-20
58.Pancakes82-29
59.Homework81+28
60.Marijuana80 
61.Diet Coke80-28
62.Hope78+15
63.Virginity76 
64.French fries75-15
65.Laziness71+5
66.Boys67 
67.Nothing67-19
68.Carbs66-4
69.Justin Bieber64 
70.Pork64 
71.Porn63+9
72.Me620
73.Sleep61-42
74.Complaining58-16
75.Eating out58-8
76.Jesus55-26
77.McDonald's55 
78.Beef54+18
79.Church54+6
80.God53-21
81.Abstinence53-39
82.Cake52 
83.Negativity52 
84.Him49 
85.Juice47 
86.Celibacy44+13
87.Chicken42 
88.Lying42 
89.New Year's resolutions42-29
90.Sarcasm42-39
91.Snacking41 
92.My wife39 
93.Tea37 
94.iPhone37 
95.Exercise36-6
96.Sweet tea35 
97.People35 
98.Vegetables34 
99.Pasta33 
100.Self control33 

Image created using Wordle.

Posted in Lent, Twitter

Videogames as Time Travel

Melik Kaylan writes in today’s Wall Street Journal about how the detailed historical settings in the videogame Assassin’s Creed II allow the player to time-travel to Renaissance Italy (link works now but may not always):

[T]he game is set in Florence, Venice and Rome over a number of decades leading up to the year 1499. The game's producer-authors… labored lovingly to re-create the environs as exactly as possible. They hired Renaissance scholars to advise on period garb, architecture, urban planning, weaponry and the like. They took tens of thousands of photographs of interiors and streets. They used Google Earth liberally to piece together the ground-up and sky-down perspectives through which the action flows…. The hazy colors and the distant sound of river birds are uncannily correct. Nowadays, the tourist hordes can blot out all sense of history. Once you've navigated it on AC2, when you visit the Ponte Vecchio in person the illusion persists of a highly intensified sense of place. In other words, the video brings the place sharply back to life.

Recreating history comes at a price: the budget for the game is something north of $20 million. I hope that the publishers will find a way to put some of their investment to educational use; I for one would love to visit Renaissance Italy without having to assassinate people once I get there.

Someday I hope to see a recreation of ancient Jerusalem this detailed, though I can’t imagine what kind of game could justify the pricetag. In the future, maybe the cost of creating virtual time travel will drop far enough to be within reach of small schools, companies, or individuals.

(Note: I haven’t played the game and don’t intend to. As you might guess from the title, it appears to involve lots of killing. If you’re OK with seeing that kind of thing, on YouTube one of the developers walks through some of the gameplay.)

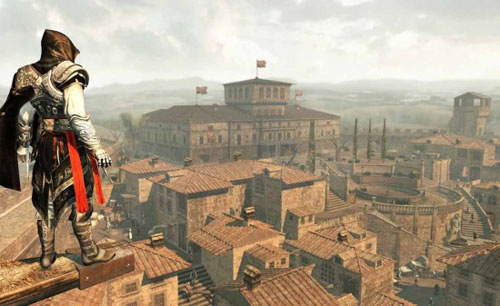
The main character in Assassin’s Creed II surveys a detailed Renaissance urban landscape.

Posted in Virtual Reality