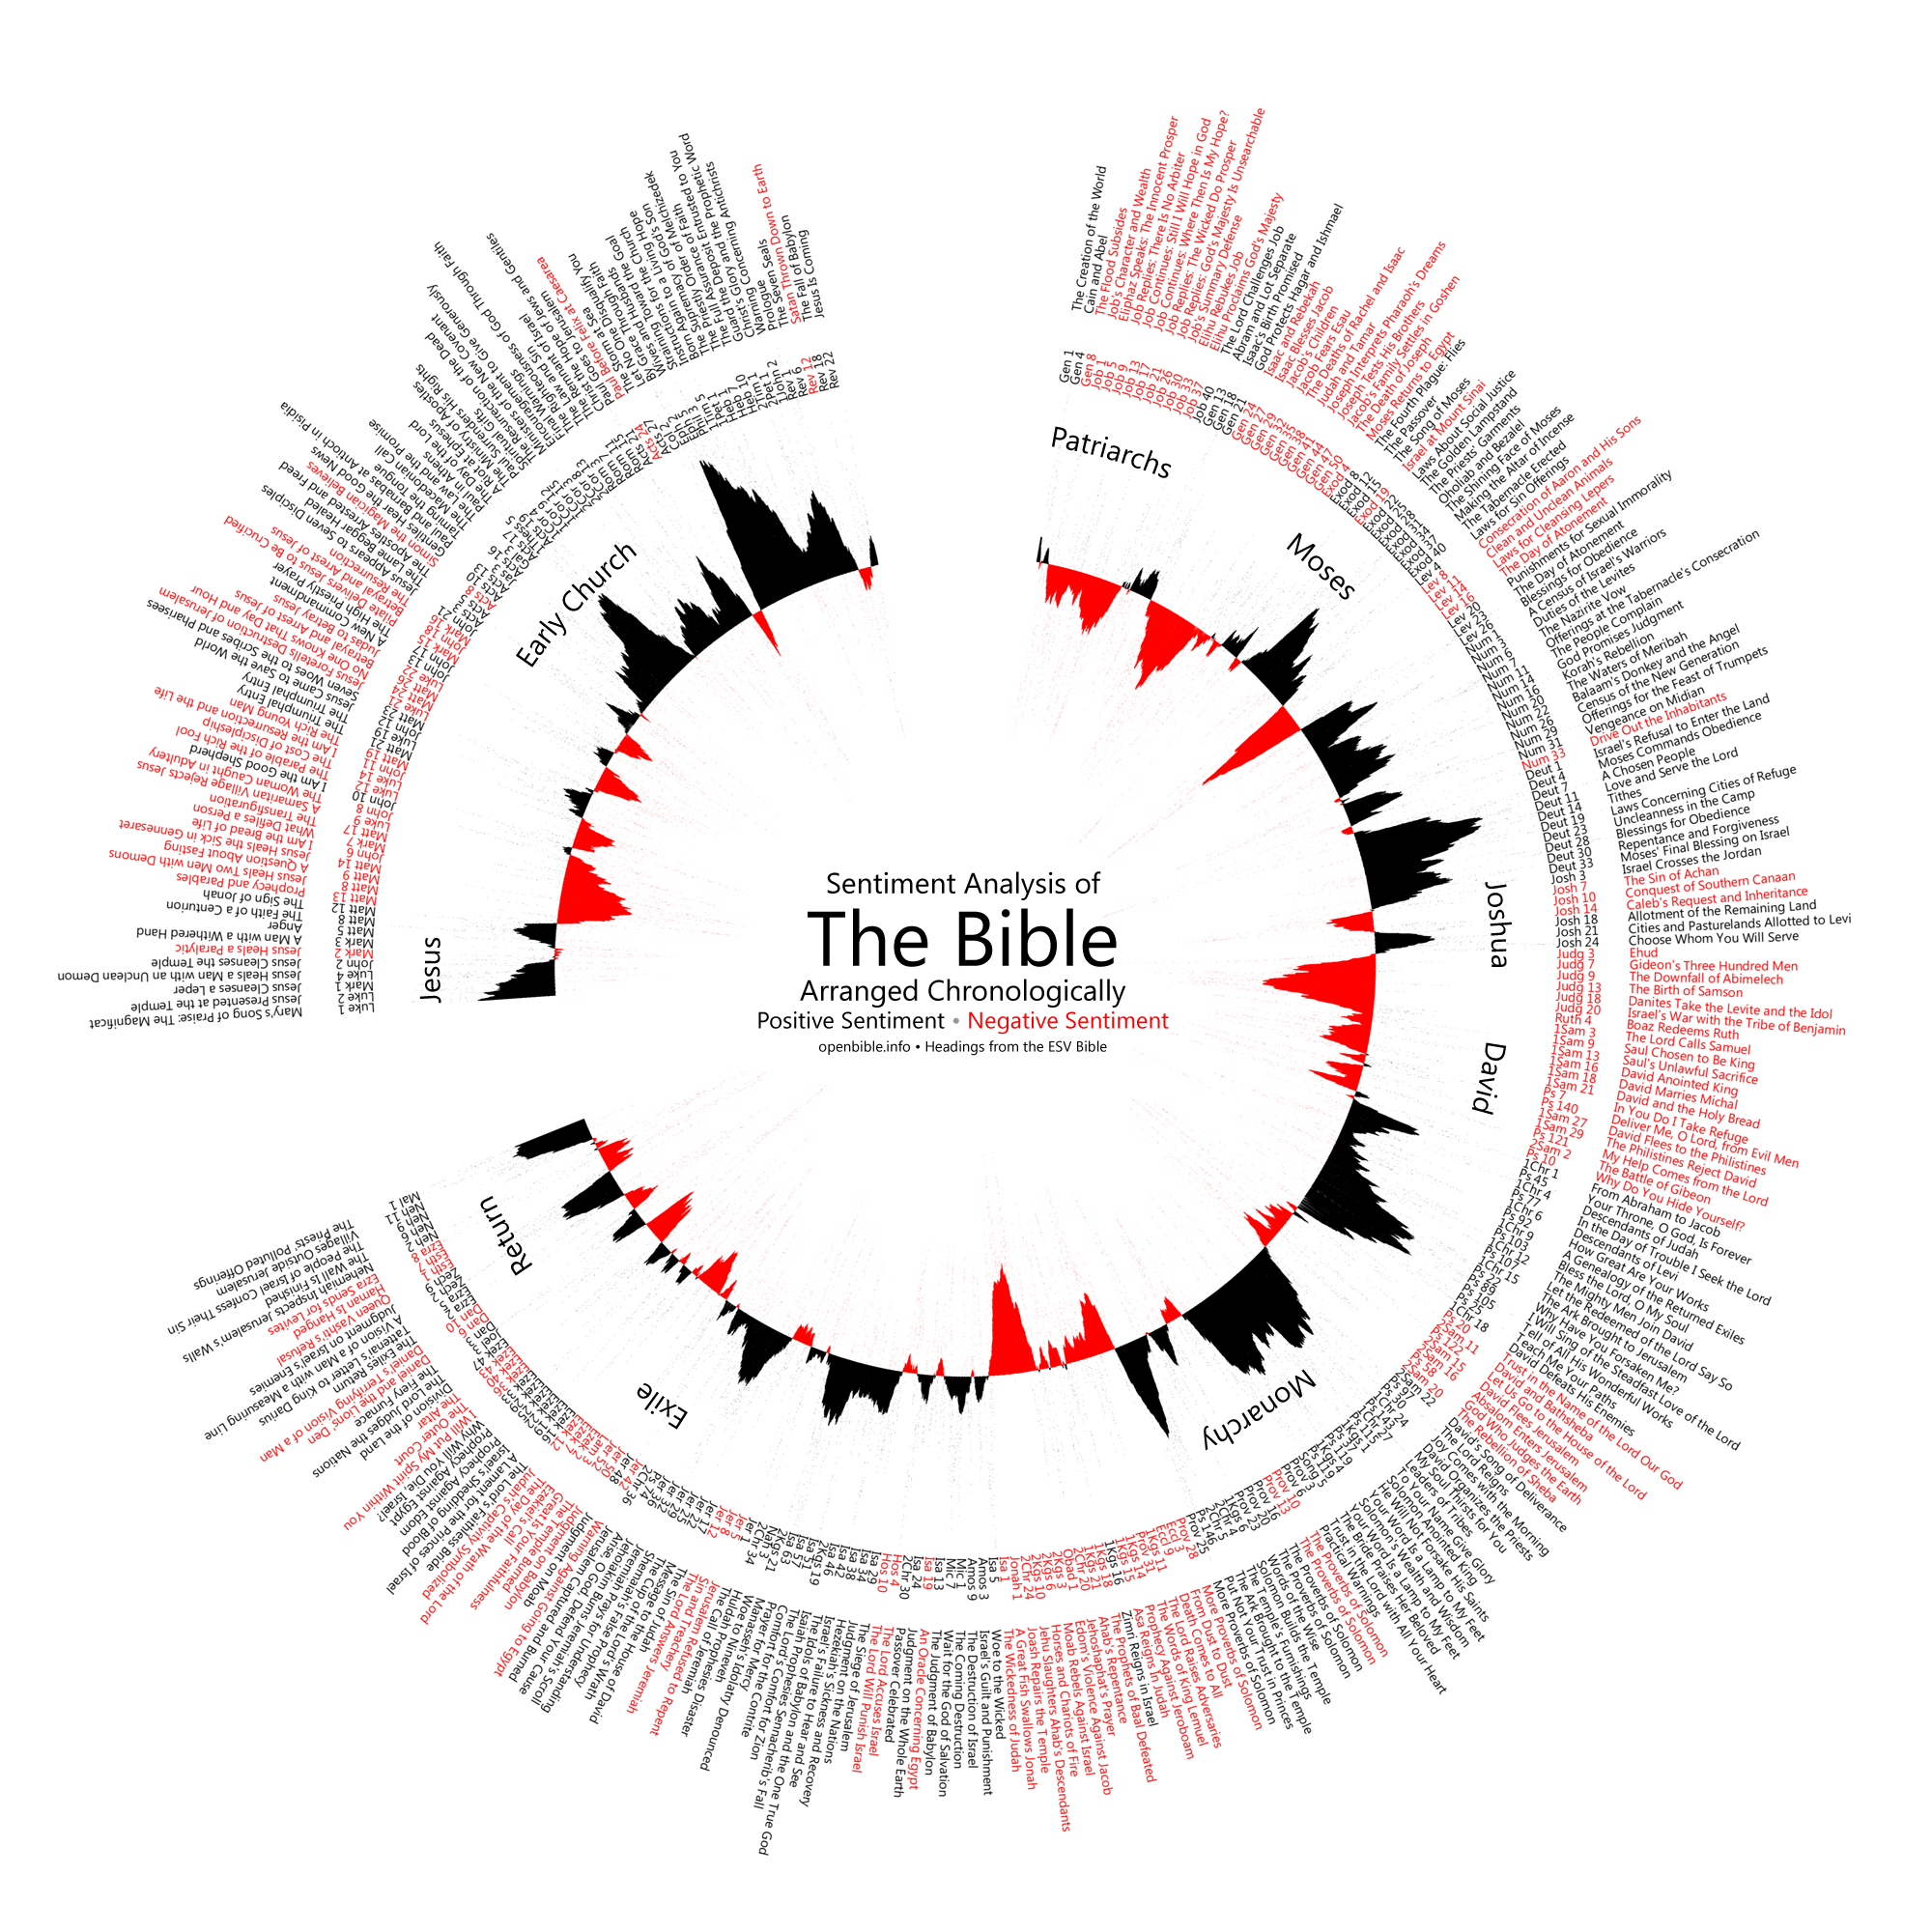
This visualization explores the ups and downs of the Bible narrative, using sentiment analysis to quantify when positive and negative events are happening:
Full size download (.png, 4000×4000 pixels).
Things start off well with creation, turn negative with Job and the patriarchs, improve again with Moses, dip with the period of the judges, recover with David, and have a mixed record (especially negative when Samaria is around) during the monarchy. The exilic period isn’t as negative as you might expect, nor the return period as positive. In the New Testament, things start off fine with Jesus, then quickly turn negative as opposition to his message grows. The story of the early church, especially in the epistles, is largely positive.
Methodology
Sentiment analysis involves algorithmically determining if a piece of text is positive (“I like cheese”) or negative (“I hate cheese”). Think of it as Kurt Vonnegut’s story shapes backed by quantitative data.
I ran the Viralheat Sentiment API over several Bible translations to produce a composite sentiment average for each verse. Strictly speaking, the Viralheat API only returns a probability that the given text is positive or negative, not the intensity of the sentiment. For this purpose, however, probability works as a decent proxy for intensity.
The visualization takes a moving average of the data to provide a coherent story; the raw data is more jittery. Download the raw data (400 KB .zip).
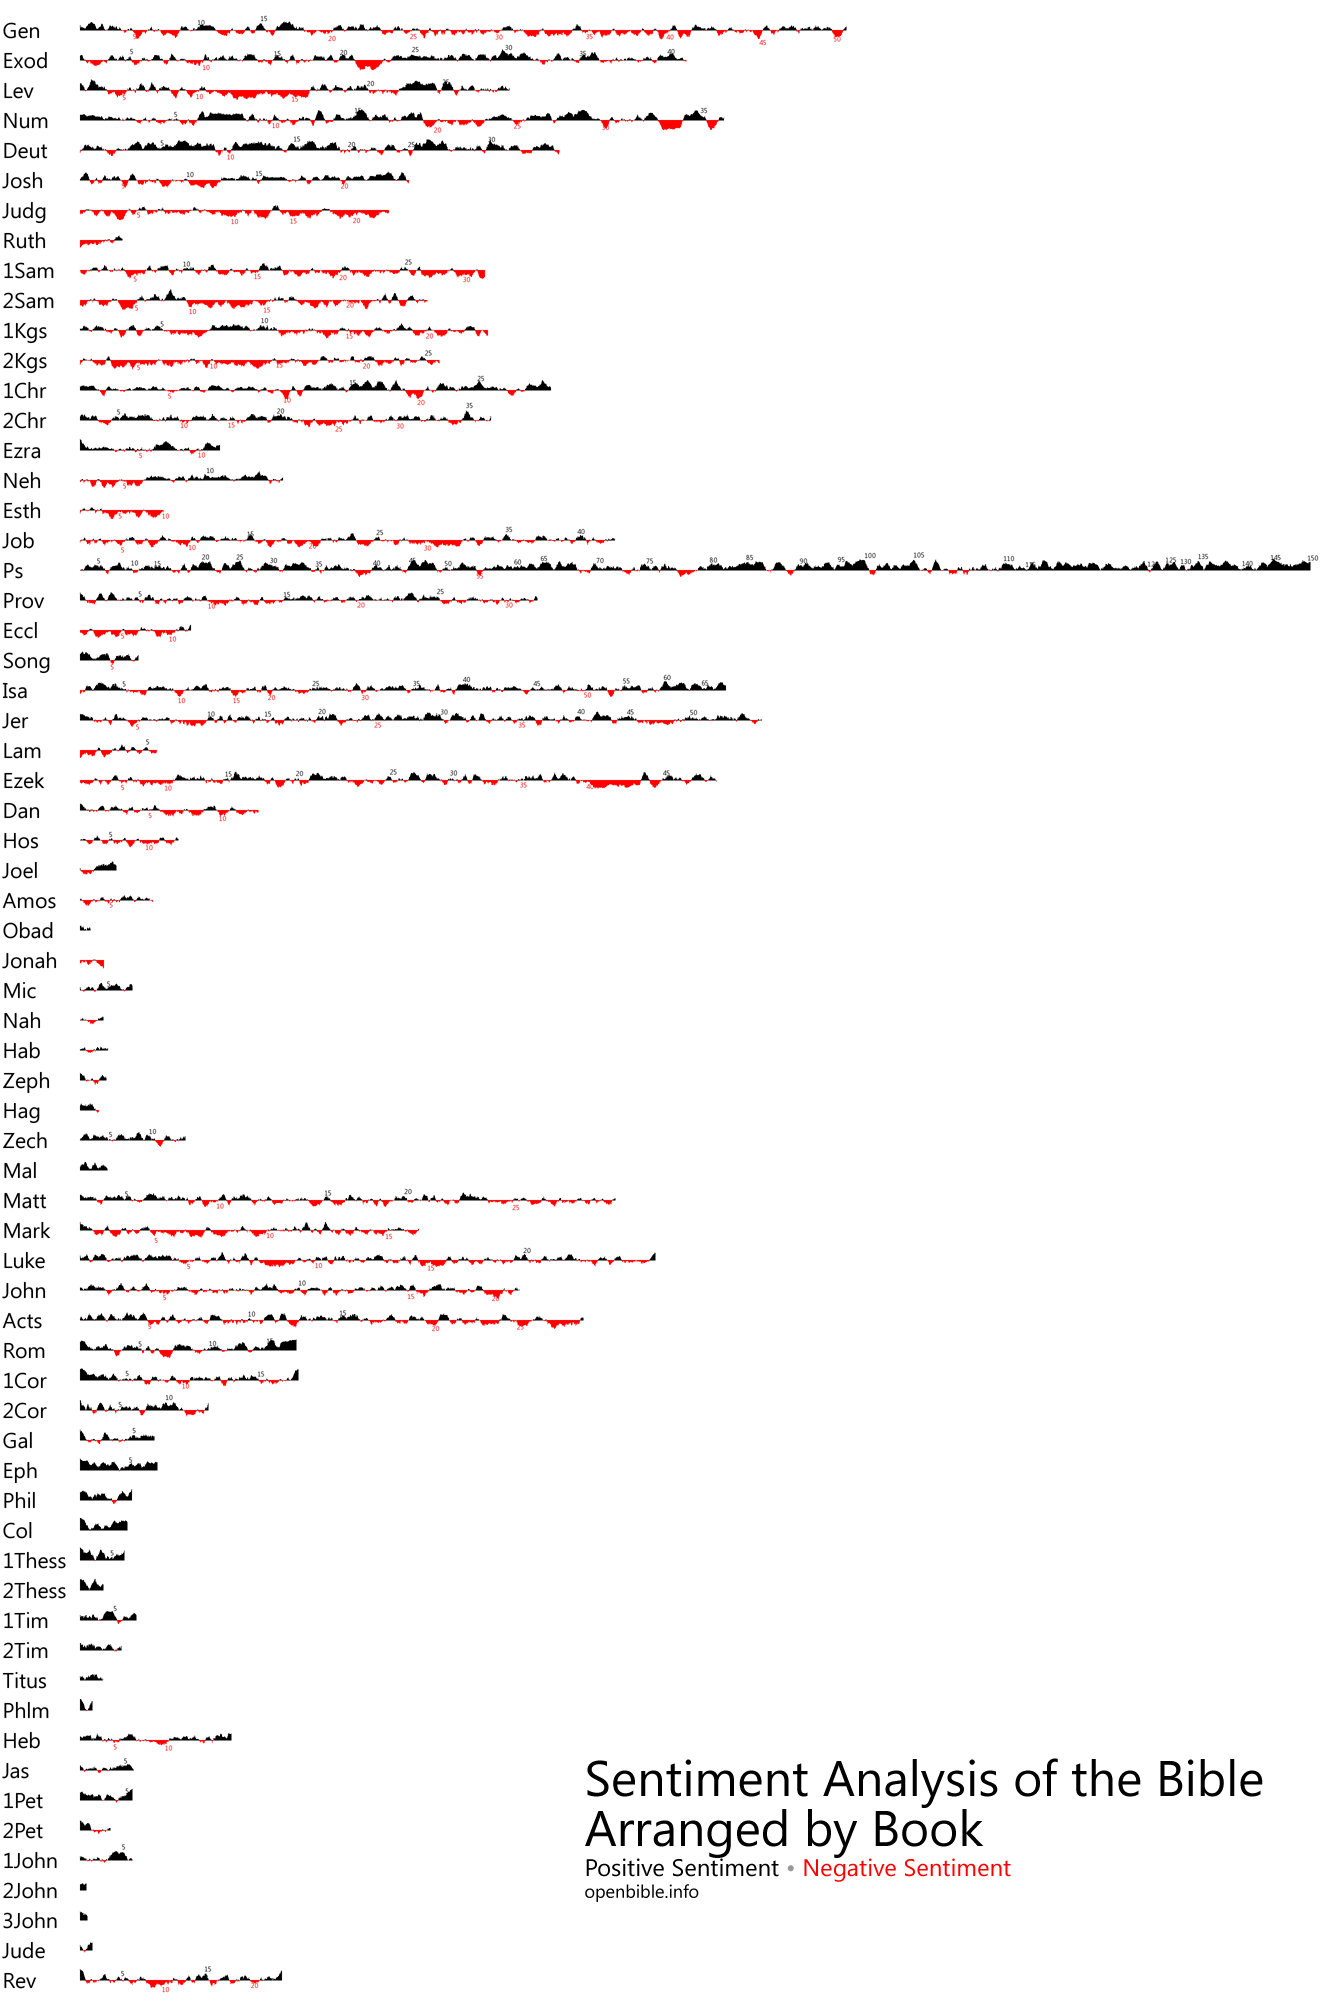
Update October 10, 2011
As requested in the comments, here’s the data arranged by book with a moving average of five verses on either side. (By comparison, the above visualization uses a moving average of 150 verses on either side.)
Full size download (.png, 2680×4000 pixels).
Update December 28, 2011: Christianity Today includes this visualization in their December issue (“How the Bible Feels”).
This is fascinating, I assume it would be (relatively) easy to do plots for individual books? I think those could show some useful and interesting results… I tried a couple of books using your data and just plotting it in Open Office, but looking at the plots, e.g. for Ruth they are too “spikey” to be really meaningful… though I noticed that (especially after Ruth 3:8 the plot is regularly higher”. I wonder if smoothing it out further by taking a moving average of three verses instead of one might give a plot that seems easier to see and so more meaningful…
Sure. I updated the post with a book-by-book breakdown using a moving average of five verses on either side. You can see pretty clearly the increasingly positive sentiment as Ruth progresses. You’re right that using a moving average is key to producing a good visualization with this data. If you haven’t tried the free Tableau Public software, it’s great for producing quick analyses of data like this (and comes with a handy moving-average tool).
The book of Jonah is actually pretty funny when you look at it this way–it goes from bad to worse.
Oh, yes 🙂 This is fascinating, as well as Ruth and Jonah, Esther needs some thought, going from mildly +ve to very negative… and I’m sure more will jump out as I look more!
[…] sense and sensibility October 11, 2011 tim No comments 0 Open Bible has a fascinating on post Applying Sentiment Analysis to the Bible. Sentiment analysis involves algorithmically determining if a piece of text is positive (“I like […]
I’d love to be able to work with you on projects like this. I think there’s a lot of room to apply newer technologies for non-traditional approaches to biblical studies/analysis. My focus is applying these techniques to the subject of the passages rather than viewing the book as the subject or focus of the visualization. It’s a hard thing to do, especially when it’s not your day job and there’s a real lack of non-proprietary data available in usable formats.
Thanks for sharing the data – if I do manage to eventually combine it with other work for my own viz, you’ve certainly saved me a lot of time on the front end.
Interesting. What tool was used to create the circular image?
It’s a custom PHP script and GD. I’d have preferred to do something vector-based but didn’t have the time.
I found this to be an interesting way of analyzing the Bible, so I decided to take a closer look. I focused on Nahum. I recently finished my MA thesis on Nahum, which included my own translation, so it is a text I am familiar with. I downloaded the raw data and then copied the data into an Excel spread sheet and sorted the data from most negative to most positive (lowest numeric value to highest).
The 5 most negative are 3:1; 1:6; 1:13; 2:11; and 3:7. Now, of those five, four are undeniably negative. But 1:13 is anything but. 1:13 (And now I will break his yoke from upon you, and your fetters I will tear to pieces)[1] is hardly negative, it is a statement of liberation, likely from the Assyrian king (though his verse has Nahum’s characteristic dangling pronouns).
The five most positive are 1:15 (2:1 in the MT); 3:14; 1:7; 1:10; and 3:2. Of these five only 1:15 is without a doubt positive. 3:14 is only positive if you take it as independent of 3:15. 3:14 is the city preparing for a siege: “Draw water for a siege for yourself, strengthen your fortresses, Go into the mud and tread the mortar, seize the brick mold!” This may seem positive, until one reads the first half of the next verse, “There [assuming in the reinforced fortress] the fire consumes you, the sword cuts you off, it consumes you like the hopping locust.” In light of 3:15, 3:14 is less a positive statement than it is a portrayal of an exercise in futility on the part of Assyria. The following verses just drive that point home even further.
Further, I am not sure why 1:10 made it into the top 5. That verse is utter gibberish and any honest translation is going to tell you that “Meaning of Heb uncertain.” I find Julia O’Brien’s suggestion that the repeated samek is supposed to recall one of drunken slurring.[2] (This also makes me think of that Isaiah 28:10 and 13, which has “nonsensical babble” from Isaiah’s opponents mocking his teaching). Further, rhetorically, 1:10 is a mockery of the enemies introduced in 1:8. It hardly functions in a positive manner.
I think that the “shape” part is a very interesting and helpful way to see how a text progresses, especially in those texts which have some sort of narrative progression. However, I am less than convinced by the “sentiment analysis.” I would need to see more about what is meant by “positive” and “negative” sentiment, especially who is defining “positive” and “negative.” Is the reader? The “original audience?” The “author?” The characters? If so, which ones? Personally, I think that sentiment analysis would be interesting to do in a context of a reader-response analysis, rather than trying to analyze the sentiment in an “objective” manner. Looking at Nahum again, commentators in the West who are part of the dominant culture are much more inclined to read Nahum as negative, while people from oppressed situations (e.g. South Africa)[3] are more inclined to read Nahum positively, if with caution.
Finally, I am not at all convinced by the algorithmic approach. It yielded results that are just plain wrong. This is not the first time we have seen an algorithmic approach miss the boat. This brings to mind the recent algorithmic analysis of the Pentateuch[4] which largely confirmed the traditional scholarly assignment of passages to J, E, P, or D, but yet did not assign Genesis 1 to P.
———————————
[1] All translations of Nahum are my own.
[2] I cannot find the reference right now, but it is in the second edition of her commentary on Nahum in the “Readings” commentary series, published by Sheffield Academic Press.
[3] See Wilhem J. Wessels, “Nahum: An Uneasy Expression of Yahweh’s Power,” OTE 11, no. 3 (1998): 615-628.
[4] http://news.yahoo.com/israeli-algorithm-sheds-light-bible-163128454.html
Very, very cool! Any chance you would be willing to share the custom PHP script you used to create the visualizations? I’d like to produce similar visualizations for some other texts.
Max: Sure. http://a.openbible.info/blog/2011-10-sentiment-php.zip . I didn’t write it with open-sourcing it in mind, so I wouldn’t exactly call the code a measure of elegance.
Justin: I largely agree that on individual verses, the results are hit-or-miss, and the data are certainly at the mercy of an opaque algorithm. In the aggregate, as you note, the trends largely fit with my basic expectations, so it may be the case of the whole being greater than the sum of its parts. Also keep in mind that the numbers are the probability of a given verse being positive or negative, not the intensity of the sentiment.
Robert: You’re right that basic Bible data is sorely lacking. I see the initial attempts that people are working on now as baby steps that others in the future can make use of to produce much richer works than we’re capable of at the moment.
I did not think that I said the aggregate is accurate; nor did I comment on the intensity of the positivity and negativity. In terms of Nahum, I dont think it is. For the faithful (see Nah 1:7 for Nahum’s vague definition of “the faithful” [1]) Nahum would be a comfort, as the name of the prophet implies (a positive sentiment). This means the classification of ch. 2 as potentially “negative” makes no sense if Nahum is viewed from this perspective. Yet, for Assyria this would be a negative text. This means that the classification of chs. 1 and 3 as potentially positive makes no sense if Nahum is viewed from this perspective.
I think that this is so off on Nahum, that it makes me suspicious of the rest of the analysis. I am not convinced that the whole is greater than the sum of its parts.
The primary problem with the algorithmic analysis lies in quantifying “positive” and “negative” because the labels “positive” and “negative” are so subjective (but not relative).
Some sort of sentiment analysis could be useful, esp. when combined with Vonneguts “story shape,” but not when it is approached algorithmically because there is no way to objectively quantify “positive” and “negative” sentiments.
————————–
[1] I am not convinced by the arguments which claim that ch.1 and chs. 2-3 are separate works, combined at a later date. The argument generally goes that chs. 2-3 are rather “secular” and therefore the more “religious” ch.1 is a clearly a separate composition. And now that we have separated ch.1 from chs. 2 and 3 we can see how “secular” chs. 2 and 3 are which means that ch.1 is a separate composition…etc. It suffers from circular logic.
Thanks for the code, openbible! I’ve coded long enough to know exactly what you mean by not writing it “with open-sourcing it in mind” so no worries. Thanks so much for sharing.
Breaking the stream of the discussion a bit… I see both this data and the graphic that was produced as being the kind of data-driven, spatial-UI app that many people outside of the pastorate could use. Normally speaking, we see this kind of data in such a linear fashion that it makes sense only if you know the context. But, the way you folks have parsed and organized the data, it should be a lot easier for anyone to see the output and then make inferences to the text (even if they are less than academically trained).
I’m posting about this at Mobile Ministry Magazine hoping that a developer or many would see your work here and think about its implications in such a spatial-UI mobile app. This could really be great for a lot of folks. As for myself, I like data – I might end up getting lost in a bit.
[…] And then someone posted this link on facebook which applies sentiment analysis to the Bible, a nice image. […]
[…] visualization showing a sentiment analysis of the Bible (http://radar.oreilly.com/2011/10/visualization-bible-sentiment.html) […]
[…] Sentiment analysis is a hot topic these days. Everyone is trying to figure out what customers mean in the free text data that they create – twitter, survey comments, product ratings and reviews, and more. O’Reilly Radar has picked some work done on the ultimate text source, the Bible, as their visualization of the week. OpenBible.info has just released a sentiment analysis visualization of the Bible. […]
[…] Sentiment Analysis to the Bibleby Tony Jones on October 16, 2011Via: OpenBible.infoHT: Bob Carlton Cancel replyLeave a CommentName *E-mail […]
[…] Sentiment Analysis to the Bible Link to original article. "This visualization explores the ups and downs of the Bible narrative, using sentiment analysis to […]
[…] quantifies the ups and downs of the Bible. Red is negative and black is negative. Things start off well with creation, turn negative with Job […]
[…] this is how you make an […]
How does the algorithm deal with texts with irony or sarcasm? For example texts see http://www.bible.gen.nz/amos/literary/literat.htm
hmmm it’d be interesting to see included books of the Catholic and Eastern Orthodox Bibles…
I’d love to buy a print of this iconographic to hang- do you have plans to sell copies?n Do you object to me taking the file and having it printed?
Greg: It probably doesn’t handle them spectacularly, but I don’t have a lot of insight into the math behind the algorithm.
Kevin: I have no plans to sell copies, but you should feel free to print it: that’s why the full-size file is there.
Like Kevin, I would LOVE to have a BIG copy of this. My printer on my desk printed a nice copy, but it is SOOOO tiny that it’s hard to read. A LARGE version on nice stock would be great!
[…] won’t start an e-Holy War, but it certainly shrinks some complex ideas down to size. Openbible.infoused algorithms to label events in the Bible according to positive or negative sentiment (“Think […]
Joel and Kevin: If you upload the full-size image to http://www.zazzle.com/cr/design/pt-print , it looks like you can get a nice 24-inch-sized poster for around $20. I’ve never used Zazzle, but I hear good things about them. Should you decide to go this route, I’d be interested in hearing how it turns out.
[…] Check out this visualization, which applies modern day sentiment analysis to the Bible. (I was surprised to see so much […]
[…] OpenBible.info ci stupisce con un infographic sulla Bibbia che, tramite loro algoritmi, evidenzia i passaggi più tetri. La rappresentazione nei dettagli non […]
This is quite an interesting way to chart the progression of the Biblical narrative. A “sentiment analysis” from OpenBible. […]
[…] img […]
[…] verder op openbible.info. facebook, Tip on Hyves Share on Linkedin twitter of […]
[…] quantifies the ups and downs of the Bible. Red is negative and black is positive. Things start off well with creation, turn negative with Job […]
Antoine (above, #15) at Mobile Ministry Magazine expands on his idea for creating an app based on the visualization. Sounds fun… and also a bit daunting to build.
[…] Things Happen in the Bible Posted on October 23, 2011 by Hemant MehtaOpenBible produced this “Sentiment Analysis of the Bible” visualization. Black means something positive is happening while red represents something […]
Out of curiosity, does it have a case for verses which seem neither positive nor negative? Or does it simply treat anything which isn’t explicitly negative as positive (or vice versa)?
John, a few verses didn’t have any sentiment either way and are indicated with blank lines in the raw data. They’re rare and are subsumed in visualization, which uses a moving average.
[…] sentiments in the bible. The black is the positive, the red is the negative. See the details here. […]