At least according to searches for end times on Bible Gateway:
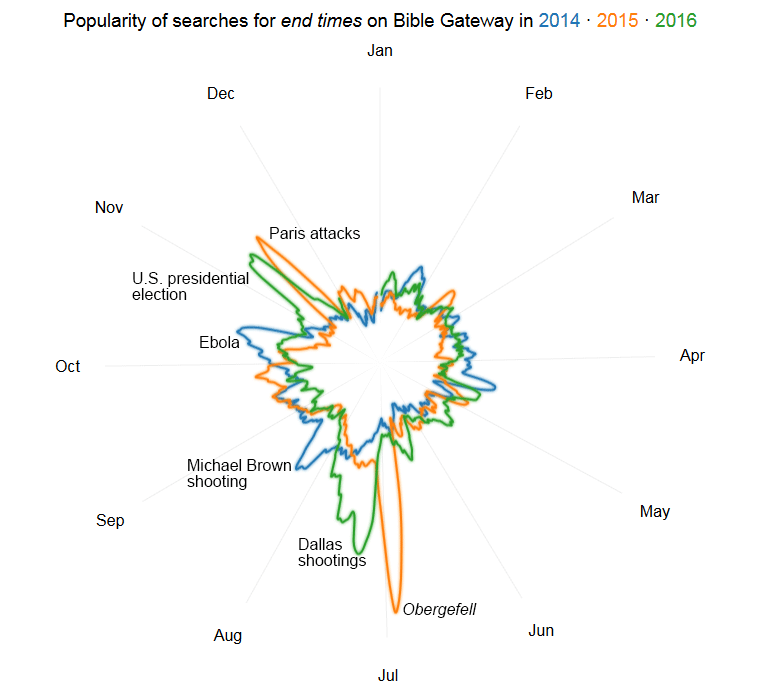
(The farther away the point is from the center of the circle, the more searches there were on that day.)
This image comes from The Three Kinds of Popular Keyword Searches on Bible Gateway, which talks about the three keyword search patterns Bible Gateway sees: perennial (not much variation throughout the year), event-driven (spikes around news cycles, like end times), and holiday-themed (spikes at the same time every year).
Bible Gateway doesn’t see much of a fourth pattern I might expect: a “seasonal” pattern that’s similar to “holiday-themed” but is more spread out and not driven by a particular day. For example, plotting Google Trends data for jacket using a similar methodology as above yields a much longer-lived rise and fall, where 75% of yearly searches happen between September and March, but there’s not a single, strong peak:
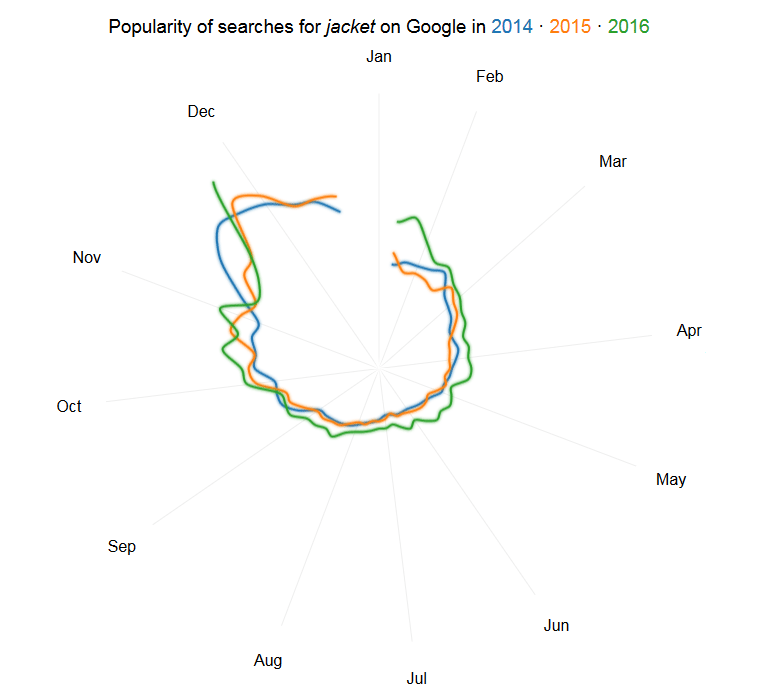
I think–but haven’t been able to locate independent research to prove–that most search keyword data will fall into one of these four patterns (perennial, event-driven, holiday-themed, and seasonal) when plotted on this kind of chart.
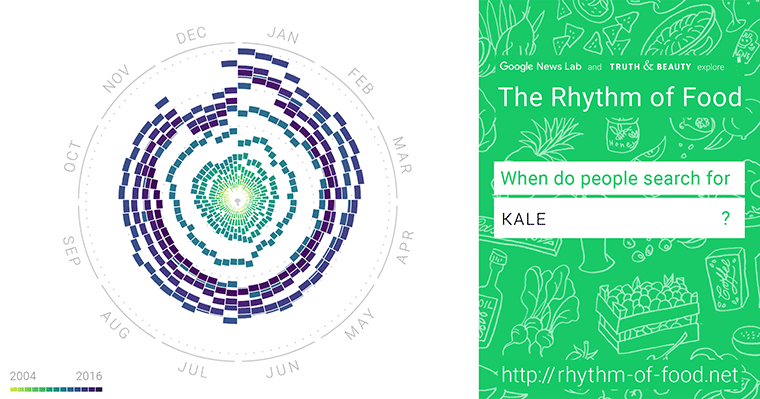
The immediate inspiration for this visualization was Google’s Rhythm of Food (also see the associated Wired article), which explores this kind of seasonality in food searches on Google: they identify “seasonal” and “holiday-themed” patterns. Rhythm of Food plots absolute numbers of queries, so you can see that searches for kale have been falling since 2014 (it’s clearer in the animation if you click through):
My interest in the Bible Gateway data wasn’t to track absolute numbers of queries but to explore yearly continuity, so each point on the Bible Gateway chart reflects the percent of queries on that day for the year (smoothed over the preceding and following three days). The downside of using percentages is that they can magnify small absolute differences.
Bible Gateway’s 2016 Year in Review lets you explore these patterns for 1,000 popular queries on Bible Gateway in 2016.
The Washington Post spins this report as More people searched the Bible for “end times” because of same-sex marriage than because of Trump.
If you’re curious how these thousand searches fit the concept / quote / entity / story framework I proposed for Bible queries in 2011, here’s how I categorize them:
| Type | Description | Example | Count |
|---|---|---|---|
| concept | “Show me verses about…” | love | 593 |
| quote | “I’m looking for a specific verse.” | I can do all things | 253 |
| entity | Person or place | Abraham | 101 |
| story | Shorthand for a longer passage | David and Goliath | 53 |