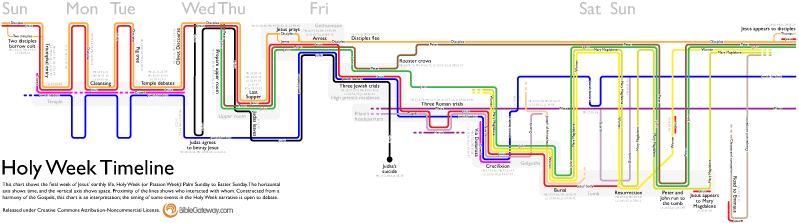
It’s always fun for me to learn the process people use to create visualizations, and especially why they made the decisions they did. So please forgive me if you find this post self-indulgent; I’m going to talk about the new Holy Week Timeline that’s on the Bible Gateway blog:
The idea for this visualization started in November 2009 when xkcd published its movie narrative charts comic, which bubbled up through the Internet and shortly thereafter became a meme. Although the charts are really just setting up a joke for the last two panels in the comic, they’re also a fantastic way of visualizing narratives, providing a quick way to see what’s going on in a story at any point in time. The format also forces you to consider what’s happening offstage—it’s not like the other characters cease to exist just because you’re not seeing them and hearing about them.
My first thought was to plot the book of Acts this way, but Acts presented too broad a scope to manage in a reasonable timeframe. Holy Week then came to mind—it involves a limited amount of time and space, it doesn’t feature too many characters, and the Gospels recount it in a good bit of detail: one Gospel often fills in gaps in another’s account.
Now I needed data. (Data is always the holdup in creating visualizations.) Fortunately, Gospel harmonies are prevalent, even free ones online. The version of Logos I have includes A. T. Robertson’s Harmony of the Gospels, so I started transcribing verse references from the pericopes listed there into a spreadsheet, identifying who’s in each one and when and where it takes place. I plowed halfway through, but then other priorities arose, and I had to abandon hopes of completing it in time for Holy Week 2010.
It lay dormant for a year (there’s not a lot of reason to publish something on Holy Week unless Holy Week is nigh). A few weeks ago, I finished itemizing the people, places, and times in Robertson. Justin Taylor last year published a harmony of Holy Week based on the ESV Study Bible, which had a slightly different take on the timeline (one that made more sense to me in certain areas), so I moved a few things around on my spreadsheet. I also consulted a couple of other study Bibles and books I had readily available to me.
With data in hand, it was time to put pencil to paper.
Version 1: Paper
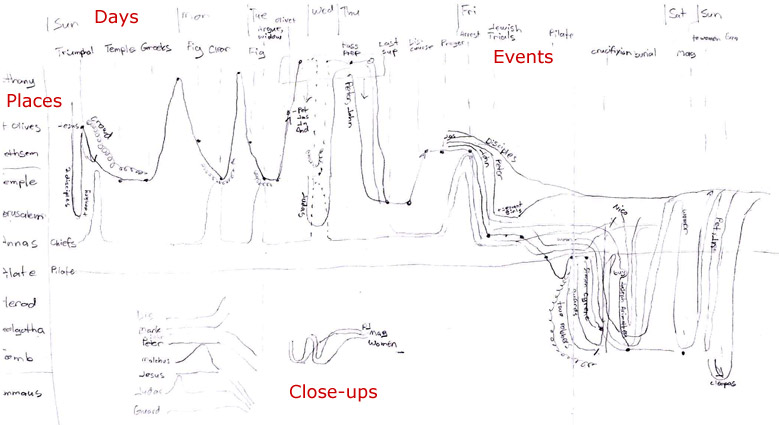
I wanted to make four basic changes to the xkcd comic: use the vertical axis consistently to show spatial progression, provide close-ups for complex narrative sequences, include every character and event, and add the days of the week to orient the viewer in time. Only the last of these changes wound up in the final product, however.
The vertical axis in this version proceeded from Bethany at the top, through the Mount of Olives and various places in Jerusalem, and ended at Emmaus. On a map of Holy Week events, this axis approximates a line running from east (Bethany) to west (Emmaus). Using the vertical axis this way encodes more information into the chart, allowing you to see everything that happened in a single location simply by following an imaginary horizontal line across the chart. Unfortunately, it also leads to a lopsided chart that progresses down and to the right, creating huge amounts of whitespace on a rectangular canvas. I didn’t see that problem yet, however.
I did see that the right half of the chart (Friday to Sunday) was much denser than the left half—I’d need to space that out better when creating a digital version.
Version 2: Drawing Freehand in Illustrator
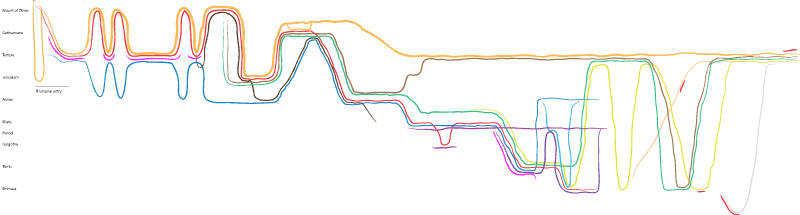
I have a confession: I’d never used Adobe Illustrator before this project. Most of my image work uses pixels; Photoshop is my constant companion. But this project would have to use vectors to allow for the constant fiddling necessary to produce a decent result at multiple sizes. So, Illustrator it was.
My first goal was to reproduce the pencil drawing with reasonable fidelity. I used my mouse to draw deliberately wobbly lines that mimicked the xkcd comic. Now, if I’d had more experience with Illustrator, the hand-drawn effect may have worked. But making changes was incredibly annoying; I had to delete sections, redraw them, and then join them to the existing lines. It took forever to make minor tweaks; what would I do when I needed to move whole lines around (as frequently happened later in the process)? After all, if you look closely, you’ll see entire swaths of the chart misplaced. (Why are the disciples hanging out in the Temple after Jesus’ arrest?) No, this hand-drawn approach was impractical for someone of my limited Illustrator experience. I needed straight lines and a grid.
Version 3: The Grid
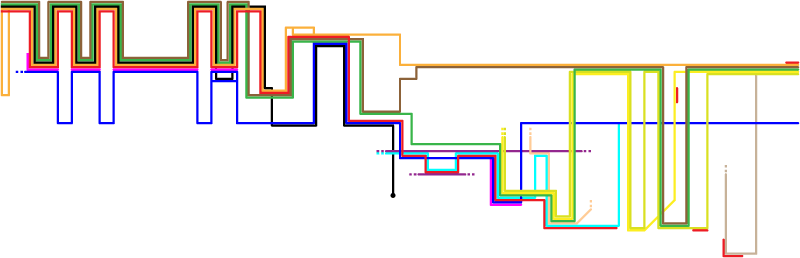
My wife says that this version reminds her of 1970s-style album covers. She’s right. Nevertheless, it formed the foundation of the final product.
So, what are the problems here? First, the lines weigh too much. Having given up a pure freehand approach, I wanted a more transit-style map (used for subways / the Underground) with straight lines and restricted angles. I’m most familiar with Chicago’s CTA map and thought I’d emulate their style of thick lines that almost touch. This approach leads to lots of heavy lines that don’t convey additional information—it’s also tricky to round the corners of such thick lines without unsightly gaps appearing (again, for someone of my limited Illustrator experience).
The second problem is the extreme weight in the upper left of the chart, far out of proportion to the gravity of events there. The green, brown, and black lines represent Peter, James, and Judas, who don’t play prominent roles until later in the story. They’re adding lots of “ink” to the chart and not conveying useful information. They had to go.
Why not simply lighten the colors–after all, why is Judas’s line black? Simple: black often represents evil. Similarly, Jesus’ line is red to represent his blood. The Jewish leaders are blue because it contrasts well with red, and most of the chart involves conflict between Jesus and the Jewish leaders (with the pink crowd usually acting as a buffer to prevent Jesus’ arrest). Pilate and Herod are imperial purple. Orange is similar in hue to Jesus’ red, so the disciples are orange. I tried not to get too heavy-handed with the symbolism, but there it is.
Most of the other colors are arbitrary (i.e., available in Illustrator’s default palette and of roughly the same saturation as the symbolic colors). John would be sharing a lot of space on the chart with Mary Magdalene and the other women, so I tried to give them colors (green, olive, yellow) that worked well together. The only future change from the color scheme in this version involves the guards, who change from cyan (too bright) to a light purple.
Version 4: Less Technicolor
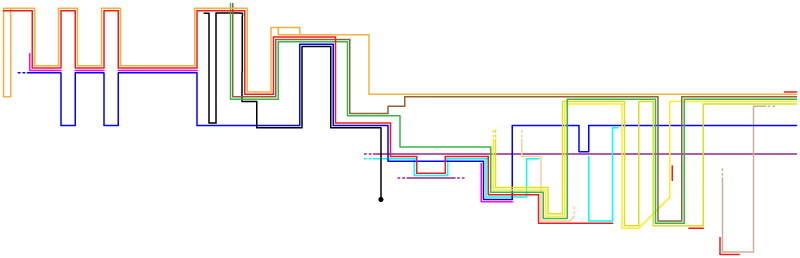
This version reduced the line weight and introduced Peter, John, and Judas only when they needed to appear as independent entities in the story. It works better, but there are still two problems with it.
First, look at the giant areas of whitespace in the bottom left and top right (especially the top right). Using the vertical axis to indicate absolute travel through space is a nice idea, but I couldn’t figure out how to do it without creating these huge gaps. In the next version, I abandoned the vertical-axis-as-space idea—it now indicated travel between places, but you could no longer follow a horizontal line to see everything that happened in a single place.
Second, I realized that I wouldn’t be able to incorporate every event and person, as they added clutter. I could have added close-ups to illustrate these details—obviously there was enough space for them. However, I felt that including them would distract from the main point: to show Holy Week at a glance. I’m still a bit torn over omitting them, but I think it was a better decision to reduce the total space used by the chart.
I also abandoned the idea that Jesus went to the Temple on Wednesday. Some commentators think he did; others disagree. From a story-structure standpoint, I like the idea that Judas slipped away from the other disciples to bargain for his thirty pieces of silver while Jesus was teaching in the Temple. However, the text is ambiguous on when exactly Judas agreed to betray Jesus and what Jesus was doing on Wednesday.
Version 5: Text
This is the final version. It condenses a lot of vertical and horizontal space; moves some lines around so they overlap less; and, most importantly, adds text: titles for major events; shading and place names for major locations; verse references; line labels; and a short explanation.
The xkcd chart is brilliant in that it doesn’t need a key: following recent trends in UI design, all the labels are inline. I definitely wanted to keep that approach, which meant making lots of labels and placing them on the lines. Again, my lack of experience with Illustrator showed up: I couldn’t get the text to center on the lines automatically, and I had trouble creating an outer glow on the text to provide some contrast with the background and make sure that the text was legible. (Black text on a bright blue background is an unpleasant combination.) But the glow always ate into the letters. Thus, I ended up creating lots of pixel-perfect, partially transparent rectangles as backgrounds for the labels. Some of the person lines had somehow slipped out of alignment with the grid, so I had to do a lot of clicking to get things back into order. In retrospect, it was good that I had to make the rectangles; I might not otherwise have noticed that the lines weren’t all where they were supposed to be.
The shaded boxes to indicate places are straight-up rounded rectangles (though I’m not sure why the corner radius is a global application preference in Illustrator). These boxes, borrowed from xkcd, replace the vertical-axis idea I earlier toyed with.
Finally, I added event titles and verse references. Here I tried to be comprehensive, including references even when I didn’t have a title to put with them. For example, there are two fig tree stories in the Gospels, but I only titled one of them. The references are available to you if you want to read both, though.
Conclusion
This project was fun, if time-consuming. In total, it took somewhere between forty and sixty hours (much of it spent climbing Illustrator’s learning curve). The chart ended up looking less like the xkcd comic and more like a transit map than I was expecting at the outset, but that’s OK. I’m now a whole lot more familiar with the Holy Week timeline, and I hope that others find the chart useful, too. If it helps improve Bible literacy even a little bit, then I consider it a success.


