Blog RSS Feed

Archive for December, 2016

The four kinds of one-year Bible reading plans

Thursday, December 29th, 2016

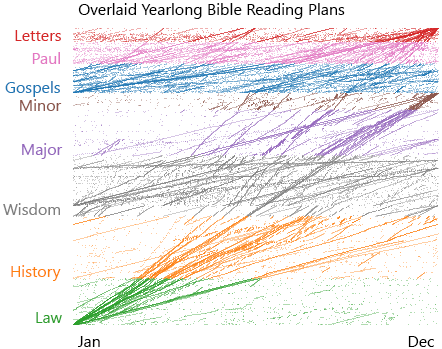
Bible.com currently has 91 yearlong reading plans. By graphing these plans with time on the x-axis (January on the left, December on the right) and verse on the y-axis (Genesis at the bottom, Revelation at the top), we can divide them into four categories, labeled below:

An 8x12 grid of 91 reading plans.

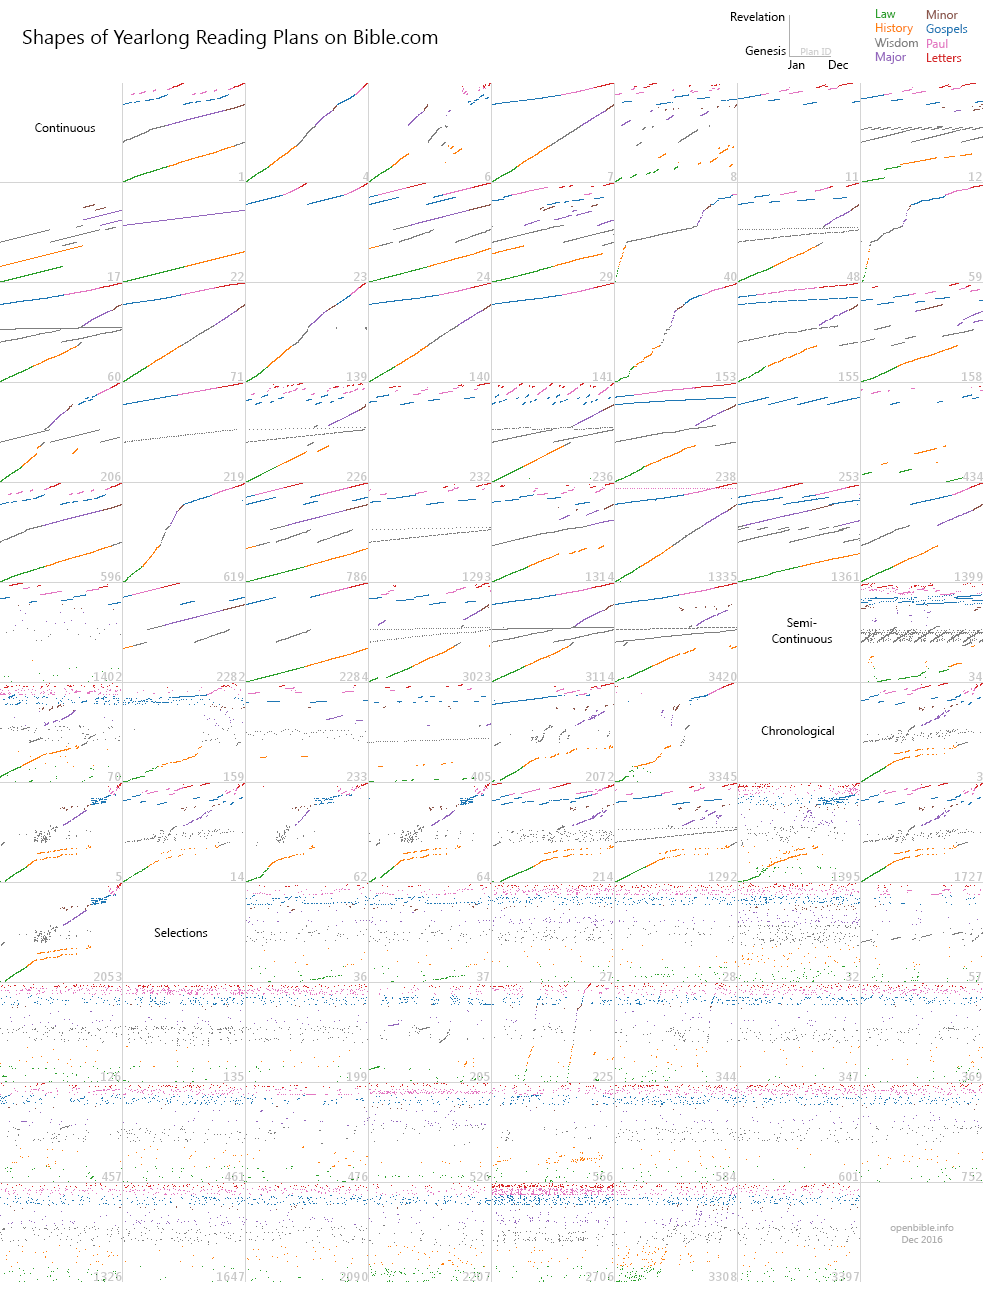
First are continuous plans, which proceed in a sequential pattern through the Bible. They’re at the top of the above chart, characterized visually by strong lines proceeding from the lower left (January / Genesis) to the upper right (December / Revelation). They tend to cover substantial portions of the Bible, usually either the whole Bible or the complete New Testament. They generally ask you to read four or fewer distinct passages per day, with each passage about a chapter long.

Next are semi-continuous plans, which are the hardest kind to define. They feature stretches of reading that immediately follow from what you’ve just read, coupled with days of reading that are… not what you just read. You can see some lines go up to the left, similar to the continuous plans, and then they stop or dissolve into smaller sections. Defining a continuous vs. a semi-continuous plan is a matter of opinion; you could argue that some of the plans I’ve classified here as semi-continuous should be continuous. The most-interesting one to me is #34, the Book of Common Prayer Daily Office, whose pattern follows the liturgical year and doesn’t resemble any other plan on the chart. (Ten years ago I plotted both years of the Book of Common Prayer on a similar chart.)

Third are chronological plans, identifiable by their unique pattern of parallel passages in Kings and Chronicles (the parallel orange lines). Not all plans in this category are strictly chronological, but they have a similar organizing principle that produces the recognizable pattern of parallel paths.

Last are selections, which follow no discernible pattern and typically involve shorter readings–a few verses from multiple places in the Bible rather than reading full chapters. This kind of plan often includes devotional content related to the selected verses. The average plan in this category covers about 1,800 verses per year, or about 6% of the Bible’s 31,000 verses.

All the plans together

Here’s what all 91 plans look like overlaid on each other:

Paths radiate from Genesis in January to Revelation in December.

Paths radiate from Genesis in January through Job later in the year, varying mostly in the pace you’re reading the bulk of the Old Testament. In other words, if your reading plan starts by reading Genesis at the beginning of the year, you’re likely to proceed sequentially through the Old Testament until you reach Psalms. Similarly, paths converge on Malachi and Revelation in December.

Where are the digital-first plans?

The similarity among these plans suggests to me that they originate from a print-first mindset: what’s convenient to read in a physical Bible. You’re not, for example, going to flip to passages all over your print Bible every day unless you have unusually strong dedication to your reading plan.

But digital reading plans don’t have this limitation. Thanks to transclusion, a digital plan can collect content from all over the Bible (and elsewhere) and show it to you in one place, which means you can read much more widely on a single day if you like.

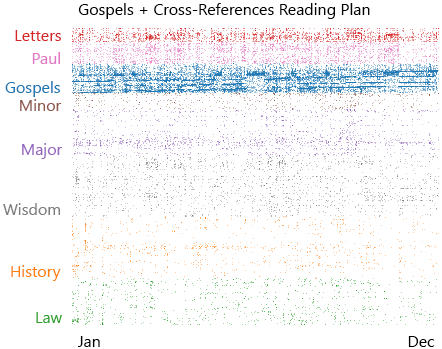
For example: let’s read through the Gospels chronologically in one year–that’s about ten verses a day–and also include ten cross-references for each verse every day. During a year, you read 14,104 different verses, or just under half the Bible. Here’s what the plan looks like schematically; you can see the paths through the Gospels, and overall it doesn’t look like any other plan:

The chronological Gospels plan shows a different pattern from other reading plans.

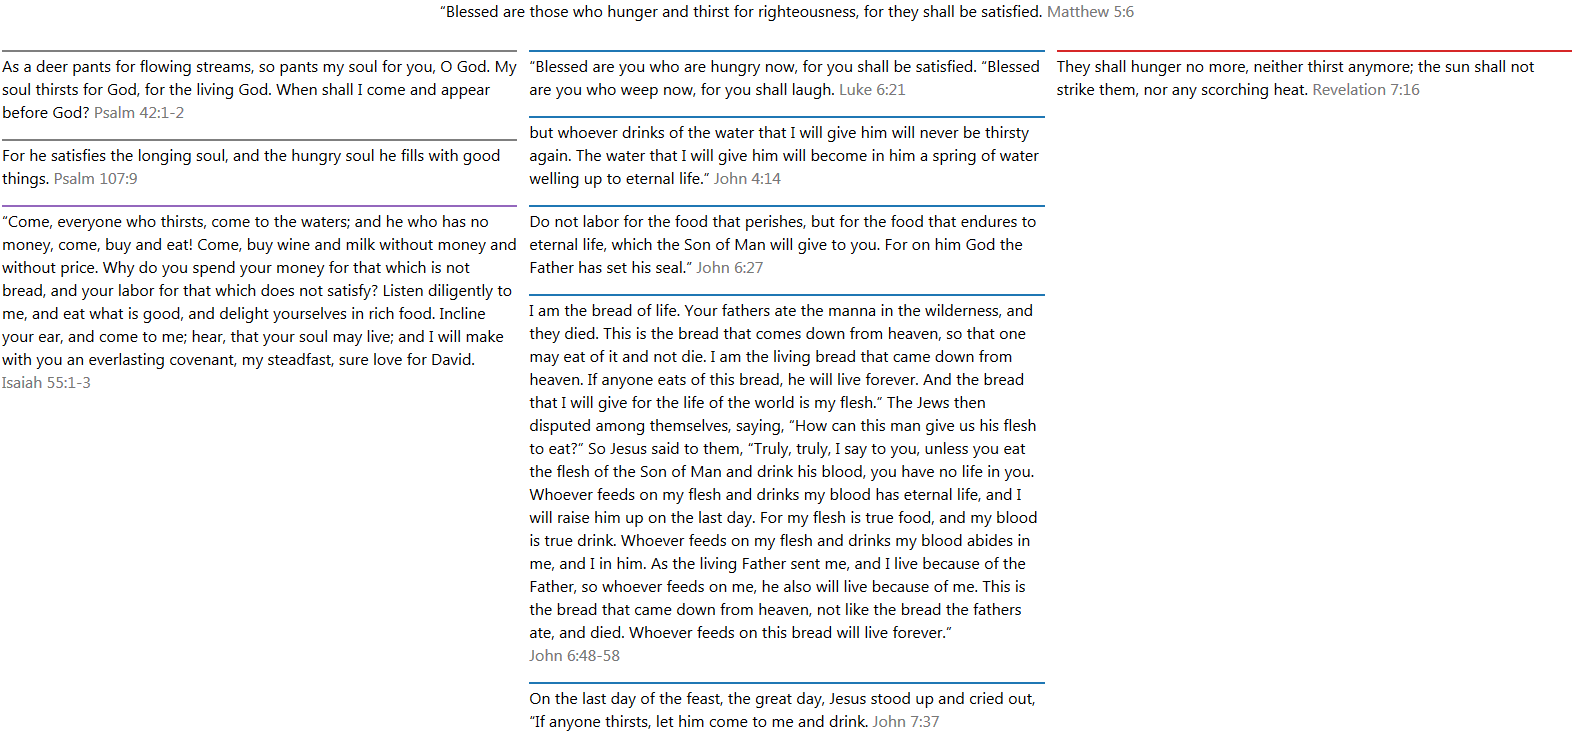
And here’s what the content for a single verse from one day’s reading could look like (because there’s so much related text for each verse, this plan requires a little information design): the current Gospel verse is at the top. Below it are three columns: one for Old Testament references, one for other Gospel references, and one for non-Gospel New Testament references. I also included the same color-coding as in the other charts in this post.

Matthew 5:5 with three columns of text.

Beyond transclusion, interactivity is a key property of digital systems. You could add interactivity by allowing the plan follower (with an interactive plan, they’re not just a “reader”) to configure the number of cross-references they read. Or tapping a cross-reference could open other verses they’ve read or will read as part of the plan–letting them explore more deeply and follow patterns as they desire. Adding interactivity to a system opens new avenues for insight.

Reading plans for augmented reality or audio-only interfaces will similarly vary in form from existing print-based plans. I would suggest that they will probably be even more conversational and dynamic than what I describe here.

I don’t know what shape future digital Bible reading plans will take, and the current approach of converting print-first plans to digital will certainly persist. But new digital-first reading plans will also come into being, and it’s important to experiment with what new technologies allow.

Super Mario Run is an exploration of free will vs. predestination

Tuesday, December 27th, 2016

Super Mario Run, an iOS game released December 15 and downloaded over 50 million times in its first five days, is a game about free will. Its three play modes reflect three different approaches to the topic.

Kingdom Builder: Free Will

The first play mode in Super Mario Run is Kingdom Builder, in which you can buy (with coins you collect elsewhere in the game) over 100 buildings and decorations to place anywhere you like on a map–think Animal Crossing or SimCity. A few buildings unlock new characters and courses, but little of what you do here affects the rest of the game.

In effect, you have consequence-less, complete free will within the constraints of the building system: you can do whatever you want.

This kingdom has lots of Toads but few buildings.

Toad Rally: “Predeathtination”

In the second mode, Toad Rally, Mario runs on what looks like a standard course with enemies and obstacles. As in World Tour (the third play mode), he runs on his own; you only control jumping. The twist is that you’re racing against another player–with success measured not in speed but in coins and skillful jumping.

But you’re not competing live against another person; rather, you’re competing against the Mario Kart-style “ghost” of another player who’s previously completed it (aka, “asynchronous multiplayer”). However, you’re not even really competing against them–you’re competing against an artificial intelligence (AI) that plays like them based on their historical playthrough. If you play the same course against the same player repeatedly, their performance and score will vary slightly.

One thing doesn’t change with every runthrough: the deaths of the other player. And that’s where predestination (in the non-salvific sense) comes in.

Luigi waits for Mario to appear on the screen.

In the above image, the current player as Luigi (in green, lower left) has run ahead of Mario and is waiting for him to appear on the screen. The circle with Mario in the upper left indicates that Mario is off the screen to the left and hasn’t arrived yet. Now look at the small “X” bubble near the yellow square on the right of the screen–it indicates that Mario will soon die there. (You can see a similar X bubble at the bottom of the screen, where Mario previously died.)

Mario jumps to his death in the flames.

This image shows the scene three seconds later: Mario has met his fate, leaping to his fiery death (the bubble he’s in will transport him back to safety). Luigi can do nothing about it–no matter how many times you repeat the course, Mario will die at this spot, his algorithmic doom determined when you first decided to challenge this player.

While your character (here, Luigi) has the jumping freedom and the constant risk of death featured in World Tour, the AI competitor doesn’t–they’re always going to die at the ordained time and place.

World Tour: Partial Free Will

The third play mode, World Tour, most closely follows the traditional Mario experience of running and jumping. However, unlike a traditional Mario game, in Super Mario Run, Mario constantly runs to the right with no input from you–you can control when he jumps by tapping the screen, and that’s about it. (I’m glossing over some subtleties.) Thus, you have limited options to explore a course when Mario is running relentlessly to the right, especially compared to the near-limitless freedom that Mario usually has in his other games.

Mario runs automatically.

In part, this control constraint reflects iOS’s touchscreen interface. Nintendo’s Shigeru Miyamoto says, “Our feeling was that by having this iPhone game in which Mario runs automatically and all you do is jump, we would actually have quite a bit of leeway to be able to create something that’s simple and easy for anyone to play, but still has some of that challenge and skill that super players desire…. By taking that approach, it would give even beginner players an opportunity to get a taste for what’s fun about the more skilled style of Mario play.”

From a game-design perspective, the single-tap interface justifies the automatic running and meets Nintendo’s goal of satisfying both novice and expert players.

However, from a philosophical perspective, World Tour reflects a hybrid of the complete free will of Kingdom Builder and the determinism of Toad Rally. Mario runs without input from you, but Mario needs you to jump, reflecting a more-constrained system than the usual Mario game has. It’s not quite the total freedom of Kingdom Builder or a typical Mario game, but neither does it feature the deadly determinism of Toad Rally. It presents a middle ground between the other two play modes.

Conclusion

The Wired article mentioned above says that a different team developed each play mode, and I suggest that each team, by accident or design, produced a distinct exploration of free will in each mode.

As you may have guessed by now, this post is mostly an attempt to justify spending $9.99 on Super Mario Run. Also, “predeathtination” (a word, oddly, that Google has never seen).

Visualizing Bible chapter similarity with Quid

Thursday, December 22nd, 2016

Quid, a natural-language processing and visualization startup*, last month produced a network graph of chapter similarity in the King James Bible. It does a good job clustering the gospels and epistles in the New Testament, though I might argue that you can largely distinguish them simply by the presence of “Jesus +said” vs. “Jesus -said”. Their full post details their methodology and colors the same visualization several different ways, including by sentiment and by popularity.

Read the article on Quid's site.
Credit: Quid

* They actually call themselves “a platform that searches, analyzes and visualizes the world’s collective intelligence to help answer strategic questions.”

How violence, disease, and Donald Trump are signs of the end times

Friday, December 9th, 2016

At least according to searches for end times on Bible Gateway:

Bible Gateway searches for end times peak during certain events.
(The farther away the point is from the center of the circle, the more searches there were on that day.)

This image comes from The Three Kinds of Popular Keyword Searches on Bible Gateway, which talks about the three keyword search patterns Bible Gateway sees: perennial (not much variation throughout the year), event-driven (spikes around news cycles, like end times), and holiday-themed (spikes at the same time every year).

Bible Gateway doesn’t see much of a fourth pattern I might expect: a “seasonal” pattern that’s similar to “holiday-themed” but is more spread out and not driven by a particular day. For example, plotting Google Trends data for jacket using a similar methodology as above yields a much longer-lived rise and fall, where 75% of yearly searches happen between September and March, but there’s not a single, strong peak:

Google searches for jacket peak in the fall and winter.

I think–but haven’t been able to locate independent research to prove–that most search keyword data will fall into one of these four patterns (perennial, event-driven, holiday-themed, and seasonal) when plotted on this kind of chart.

The immediate inspiration for this visualization was Google’s Rhythm of Food (also see the associated Wired article), which explores this kind of seasonality in food searches on Google: they identify “seasonal” and “holiday-themed” patterns. Rhythm of Food plots absolute numbers of queries, so you can see that searches for kale have been falling since 2014 (it’s clearer in the animation if you click through):

Google searches for kale peaked in January 2014.

My interest in the Bible Gateway data wasn’t to track absolute numbers of queries but to explore yearly continuity, so each point on the Bible Gateway chart reflects the percent of queries on that day for the year (smoothed over the preceding and following three days). The downside of using percentages is that they can magnify small absolute differences.

Bible Gateway’s 2016 Year in Review lets you explore these patterns for 1,000 popular queries on Bible Gateway in 2016.

The Washington Post spins this report as More people searched the Bible for “end times” because of same-sex marriage than because of Trump.

If you’re curious how these thousand searches fit the concept / quote / entity / story framework I proposed for Bible queries in 2011, here’s how I categorize them:

Type Description Example Count
concept “Show me verses about…” love 593
quote “I’m looking for a specific verse.” I can do all things 253
entity Person or place Abraham 101
story Shorthand for a longer passage David and Goliath 53