Blog RSS Feed

Archive for March, 2019

What Twitterers Are Giving up for Lent (2019 Edition)

Saturday, March 9th, 2019
Social networking tops the list of what Twitterers are giving up for Lent in 2019.

This year social networking topped the list, as it did last year, followed by alcohol, Twitter, chocolate, and, ironically, Lent. Swearing fell to #7 this year from #5 last year. With the absence of a major political or social event, 2019 was a fairly typical year for what people said they would give up for Lent.

This year, 44,291 tweets (excluding retweets) specifically mentioned giving up something, up from last year’s 29,609. In all, this year’s analysis covers 491,069 tweets, up from 427,810 last year.
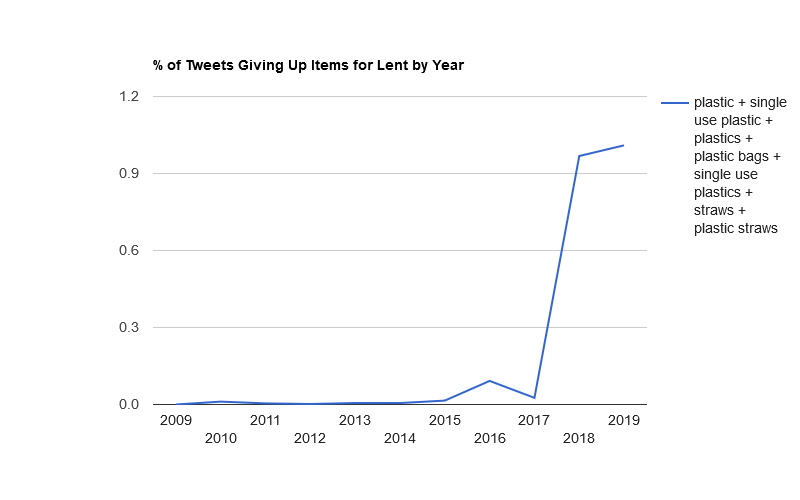
Plastic

Giving up plastic has become increasingly popular in the past two years. In all, 464 tweets this year mentioned plastic of some sort, which would almost bring it into the top ten.
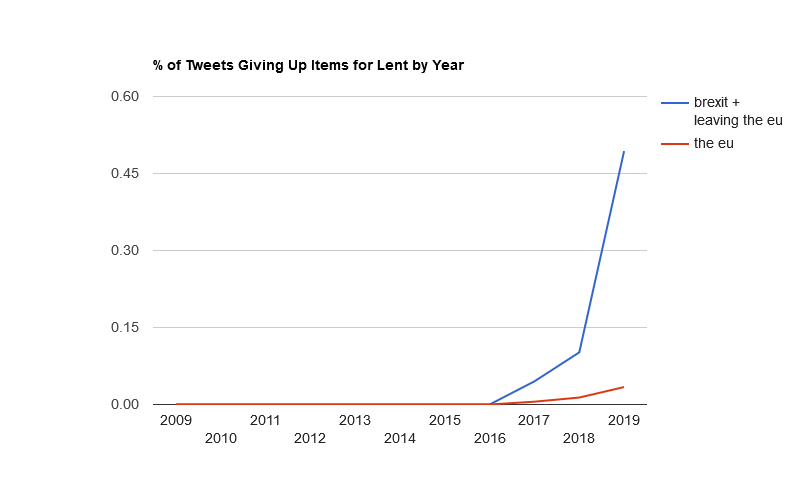
Over 1% of tweets this year mentioned plastic.

Brexit

The one major political event occurring over Ash Wednesday involved the ongoing Brexit debate. When British Prime Minister Theresa May accepted a suggestion that British lawmakers give up the EU for Lent, it led others to tweet the opposite:

Tweets about leaving the EU and Brexit outnumber tweets about the EU.

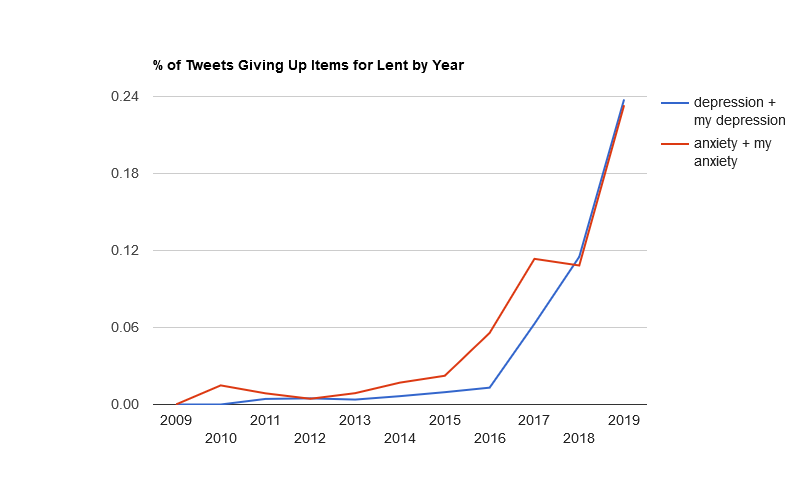
Depression and Anxiety

It was a banner year for those who said they were giving up both:
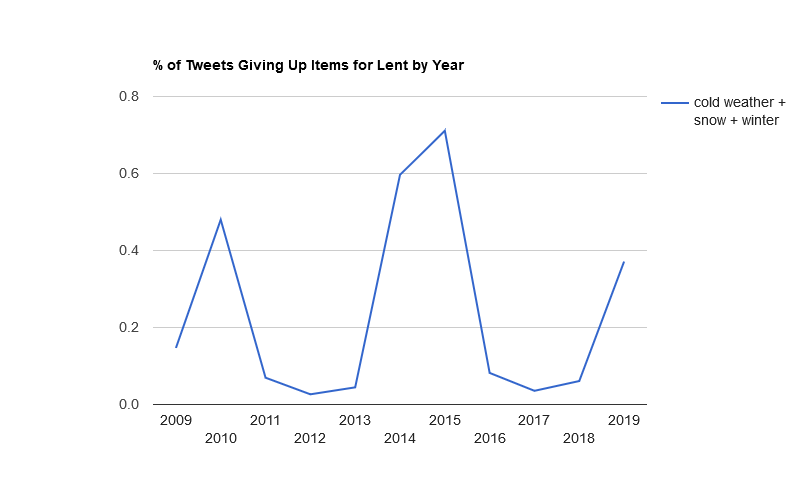
Tweets about both depression and anxiety increased substantially this year.

Winter

Tweets about cold weather were up this year, as they are cyclically depending on the severity of winter weather:
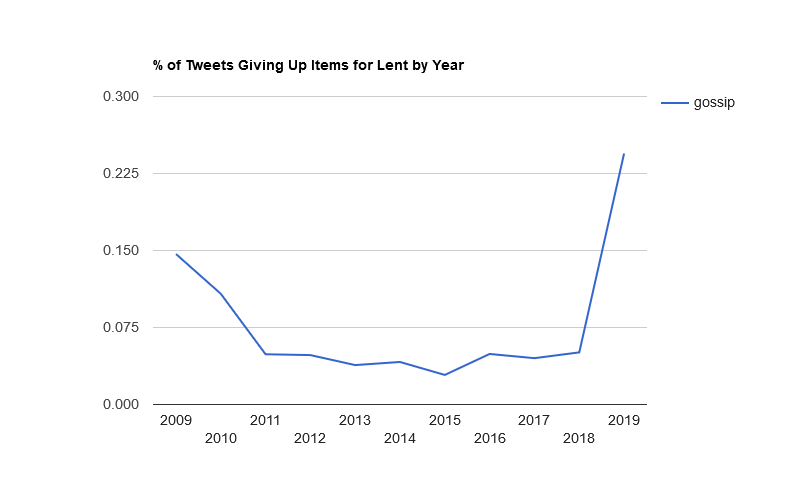
Tweets about both cold weather last peaked in 2015.

Gossip

Pope Francis this year suggested giving up gossip for Lent, leading to an increase in the number of tweets about it:
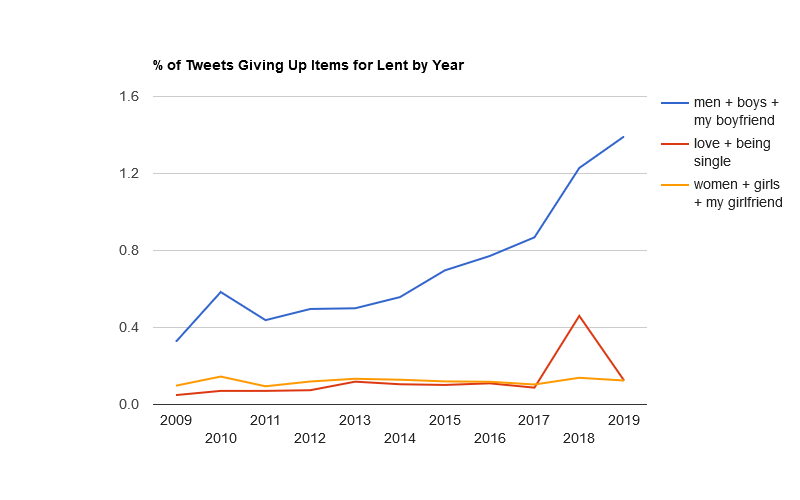
Tweets about gossip reached a new high this year.

Relationships

Even though last year Ash Wednesday fell on Valentine’s Day, this year the percentage of people saying they were going to give up a significant other rose:
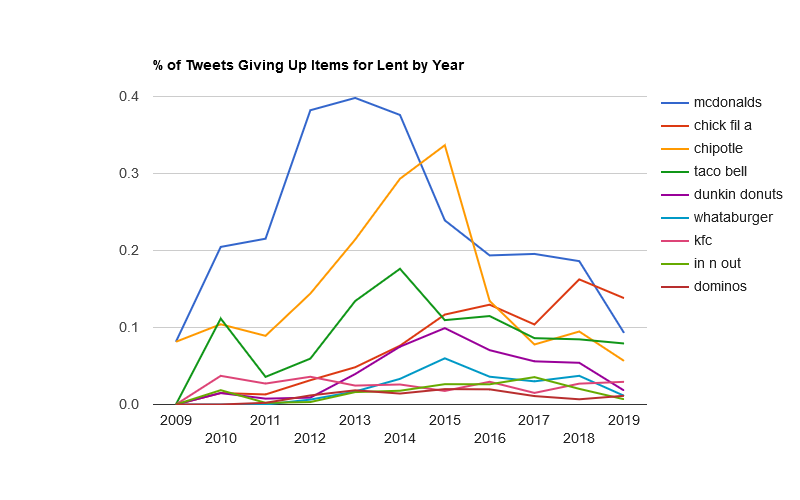
The generic 'love' fell overall, however.

Fast Food

Chick-fil-A finally surpassed McDonald’s this year, and Chipotle continues its decline:

Taco Bell could surpass McDonald's next year.

Other Updates from Last Year

Hot Cheetos finally declined. Smoking and Juuling both rose. Tide Pods look to be a one-year phenomenon, along with Fortnite. Snapchat dropped off a cliff.

Top 100 Things Twitterers Gave Up for Lent in 2019

1.Social networking1,5290
2.Alcohol1,498+1
3.Twitter1,409-1
4.Chocolate8180
5.Lent770+6
6.Meat6840
7.Swearing606-2
8.Coffee563+1
9.Soda561-1
10.Sex511+3
11.Fast food473-1
12.Sweets460-5
13.School414+2
14.Men374+6
15.Work367+11
16.College346+9
17.Religion346+15
18.Bread336-4
19.You3270
20.Plastic3120
21.Sugar2940
22.Catholicism290+15
23.Giving up things289+10
24.Beer274-6
25.Chips269-9
26.Life258+3
27.Facebook227-15
28.Marijuana224+3
29.Brexit212+47
30.Boys204-8
31.Instagram195-4
32.Virginity187+28
33.Smoking175+7
34.Candy161-11
35.Starbucks144-1
36.Junk food138-3
37.Hope128+22
38.Homework128+8
39.Rice127+8
40.Breathing125+32
41.Cheese122-5
42.Donald Trump122+18
43.Red meat121-8
44.Lying1180
45.Food113+24
46.Wine111-5
47.Carbs111-6
48.Winter110+48
49.Fried food109+1
50.Masturbation109+6
51.Gossip108+41
52.Depression105+26
53.Anxiety103+30
54.Ice cream103-4
55.My job103+26
56.Him98+10
57.Cookies98-5
58.Pizza96-20
59.People94-5
60.Dairy94-15
61.Booze92-13
62.Procrastination91-3
63.Single use plastic84-10
64.Eating out840
65.Liquor81-7
66.Juuling80-1
67.Boba79+4
68.Christianity76+15
69.Takeout75-10
70.Caffeine75-15
71.Shopping74-17
72.Negativity73-46
73.My will to live69-1
74.Sobriety68-16
75.Online shopping66-1
76.Bills64+19
77.French fries64-16
78.Lint63+6
79.Chick Fil A61-16
80.Complaining61-29
81.Sleep61-11
82.Desserts60-15
83.Church60-5
84.Coke59-16
85.Pussy59-6
86.Hot Cheetos56-25
87.Netflix55-25
88.God54-3
89.Porn53-24
90.Snapchat50-73
91.Stress50-3
92.Oxygen50+4
93.Spending50-3
94.Pancakes46-21
95.Crying46-1
96.Diet coke46-19
97.Juice45-15
98.Chicken44-19
99.Cheating43-19
100.F***boys43-43

Top Categories

This year, the top celebrity was BTS, a Korean boy band / all-consuming lifestyle.

1.food8,004
2.technology3,688
3.habits2,963
4.smoking/drugs/alcohol2,820
5.irony2,097
6.relationship1,800
7.school/work1,490
8.sex1,164
9.religion1,016
10.politics440
11.generic427
12.money353
13.health/hygiene348
14.entertainment224
15.shopping182
16.weather171
17.sports165
18.possessions54
19.celebrity24
20.clothes16

Media Coverage

The Lent Tracker received some media attention this year:

Track in Real Time What People Are Giving Up for Lent in 2019

Monday, March 4th, 2019

See the top 100 things people are giving up for Lent in 2019 on Twitter, continually updated until March 9, 2019. You can also use the Historical Lent Tracker to see trends since 2009, though 2019 is still in flux, so I wouldn’t draw any conclusions about 2019 yet.

As I write this post, with about 1,500 tweets analyzed, perennial favorites “social networking,” “alcohol,” and “twitter” lead the list. If I had to guess, with an unusually cold February across much of the U.S., weather might feature more prominently this year than last year, when Ash Wednesday coincided with Valentine’s Day.

Look for the usual post-mortem on March 10, 2019.

Using Machine Learning to Enhance the Resolution of Bible Maps

Friday, March 1st, 2019

In a previous post, I discussed how 3D software could improve the resolution of Bible maps by fractally enhancing a digital elevation model and then synthetically creating landcover. In this post I’ll look at how machine learning can increase the resolution of freely available satellite images to generate realistic-looking historical maps.

Acquiring satellite imagery

The European Sentinel-2 satellites take daily photos of much of the earth at a ten-meter optical resolution (i.e., one pixel represents a ten-meter square on the ground). The U.S. operates a similar system, Landsat 8, with a fifteen-meter resolution. Commercial vendors offer much higher-resolution imagery, similar to what you find in Google Maps, at a prohibitive cost (thousands of dollars). By contrast, both Sentinel-2 and Landsat are government-operated and have freely available imagery. Here’s a comparison of the two, zoomed in to level 16 (1.3 meters per pixel), or well above their actual resolution:

Sentinel-2 shows more washed-out colors at a higher resolution than Landsat 8.

The Sentinel-2 imagery looks sharper thanks to its higher resolution, though the processing to correct the color overexposes the light areas, in my opinion. Because I want to start with the sharpest imagery, for this post I’ll use Sentinel-2.

I use Sentinel Playground to find a scene that doesn’t have a lot of clouds and then download the L2A, or atmosphere- and color-corrected, imagery. If I were producing a large-scale map that involved stitching together multiple photos, I’d use something like Sen2Agri to create a mosaic of many images, or a “basemap” (as in Google Maps). (Doing so is complicated and beyond the scope of this post.)

I choose a fourteen-kilometer-wide scene from January 2018 showing a mix of developed and undeveloped land near the northwest corner of the Dead Sea at a resolution of ten meters per pixel. I lower the gamma to 0.5 so that the colors approximately match the colors in Google Maps to allow for easier comparisons.

The Sentinel-2 scene.

Increasing resolution

Enhance!” is a staple of crime dramas, where a technician magically increases the resolution of a photo to provide crucial evidence needed by the plot. Super-resolution doesn’t work as well in reality as it does in fiction, but machine learning algorithms have increased in their sophistication in the past two years, and I thought it would be worth seeing how they performed on satellite photos. Here’s a detail of the above image, as enlarged by four different algorithms, plus Google Maps as the “ground truth.”

Comparison of four different super-resolution algorithms plus Google Maps, as discussed in the following paragraphs.

Each algorithm increases the original resolution by four times, providing a theoretical resolution of 2.5 meters per pixel.

The first, “raw pixels,” is the simplest; each pixel in the original image now occupies sixteen pixels (4×4). It was instantaneous to produce.

The second, “Photoshop Preserve Details 2.0,” uses the machine-learning algorithm built into recent versions of Photoshop. This algorithm took a few seconds to run. Generated image (1 MB).

The third, ESRGAN as implemented in Runway, reflects a state-of-the-art super-resolution algorithm for photos, though it’s not optimized for satellite imagery. This algorithm took about a minute to run on a “cloud GPU.” Generated image (1 MB).

The fourth, Gigapixel, uses a proprietary algorithm to sharpen photos; it also isn’t optimized for satellite imagery. This algorithm took about an hour to run on a CPU. Generated image (6 MB).

The fifth, Google Maps, reflects actual high-resolution (my guess is around 3.7 meters per pixel) photography.

Discussion

To my eye, the Gigapixel enlargement looks sharpest; it plausibly adds detail, though I don’t think anyone would mistake it for an actual 2.5-meter resolution satellite photo.

The stock ESRGAN enlargement doesn’t look quite as good to me; however, in my opinion, ESRGAN offers a lot of potential if tweaked. The algorithm already shows promise in upscaling video-game textures–a use the algorithm’s creators didn’t envision–and I think that taking the existing model developed by the researchers and training it further on satellite photos could produce higher-quality images.

I didn’t test the one purpose-built satellite image super-resolution algorithm I found because it’s designed for much-higher-resolution (thirty-centimeter) input imagery.

Removing modern features

One problem with using satellite photos as the base for historical maps involves dealing with modern features: agriculture, cities, roads, etc., that weren’t around in the same form in the time period the historical map is depicting. Machine learning presents a solution for this problem, as well; Photoshop’s content-aware fill allows you to select an area of an image for Photoshop to plausibly fill in with similar content. For example, here’s the Gigapixel-enlarged image with human-created features removed by content-aware fill:

Modern features no longer appear in the image.

I made these edits by hand, but at scale you could use OpenStreetMap’s land-use data to mask candidate areas for content-aware replacement:

Data from OpenStreetMap shows roads, urban areas, farmland, etc.

Conclusion

If you want to work with satellite imagery to produce a high-resolution basemap for historical or Bible maps, then using machine learning both to sharpen them and to remove modern features could be a viable, if time-consuming, process. The image in this post covers about 100 square kilometers; modern Israel is over 20,000 square kilometers. And this scene contains a mostly undeveloped area; large-scale cities are harder to erase with content-aware fill because there’s less surrounding wilderness for the algorithm to work with. But if you’re willing to put in the work, the result could be a free, plausibly realistic, reasonably detailed map over which you can overlay your own data.