This year social networking topped the list, followed by Twitter, alcohol, chocolate, and swearing. It was a fairly typical year, with the top five the same as last year (though in a different order)–except for swearing, which came in at #6 last year, behind chips. (Chips had received a boost last year from Theresa May’s vow to give them up; this year they returned to closer to their usual spot.)
This year, 29,609 tweets (excluding retweets) specifically mention giving up something, down substantially from last year’s 73,334. In all, this year the analysis covers 427,810 tweets, down from 694,244 last year.
Relationships
As expected with Valentine’s Day falling on Ash Wednesday this year, relationship-related tweets increased:

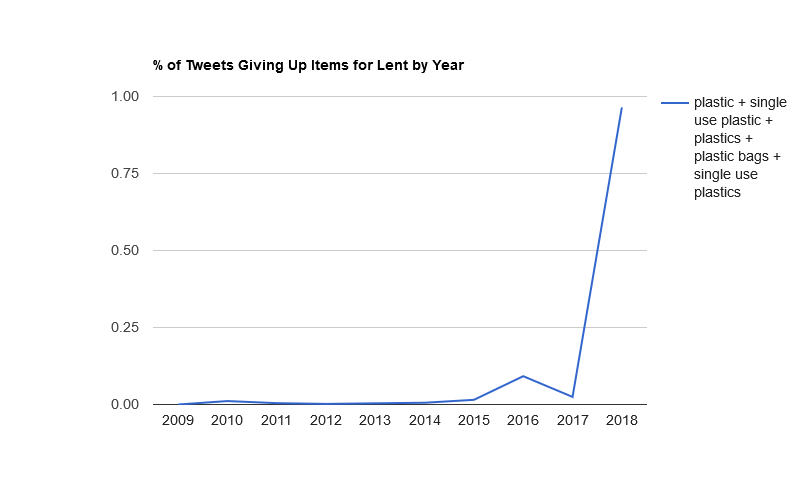
Plastic
Plastic also jumped substantially this year, boosted by the Church of England’s suggestion that followers give up various forms of plastic for Lent.
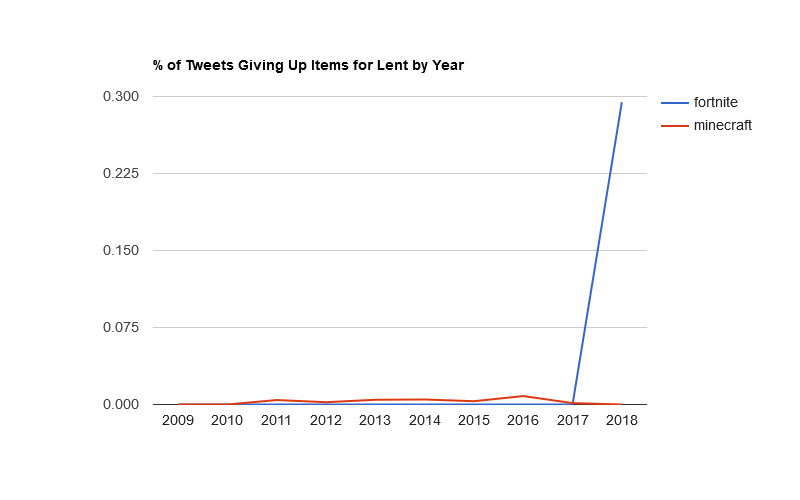
Fortnite
New to the list this year is Fortnite, a Hunger Games-style video game:
“It’s all they talk about,” said Glen Irvin, a teacher coach at a high school in Sauk Rapids, Minn., of “Fortnite”-playing students. “The only other game I’ve ever heard kids get this passionate about is ‘Minecraft.’”
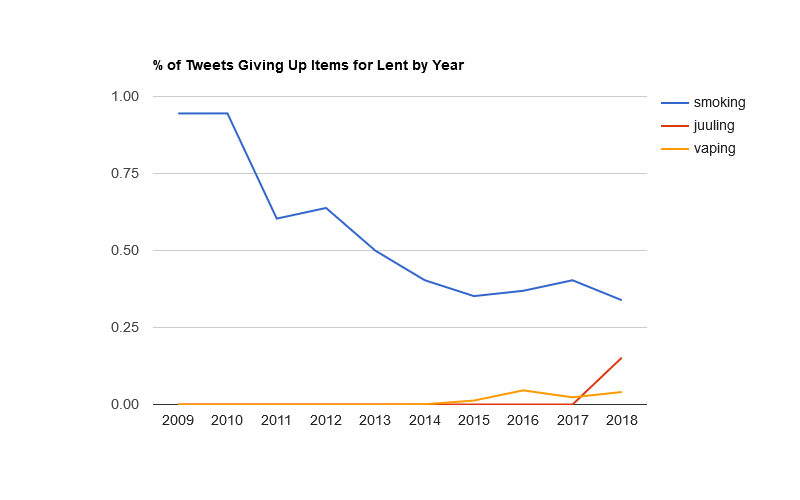
Juuling
Also new this year is juuling, a slick and covert way to vape:
Resembling a flash drive, Juul conveys a sense of industry — you’re Juuling into your MacBook Air while you are cramming for your test on Theodore Dreiser and thinking about trigonometry — and it is so easy to conceal that, as one mother explained to me, she failed to notice that her daughter was vaping in the back seat of the car as she was driving.
Giving up juuling this year was nearly half as popular as giving up smoking:
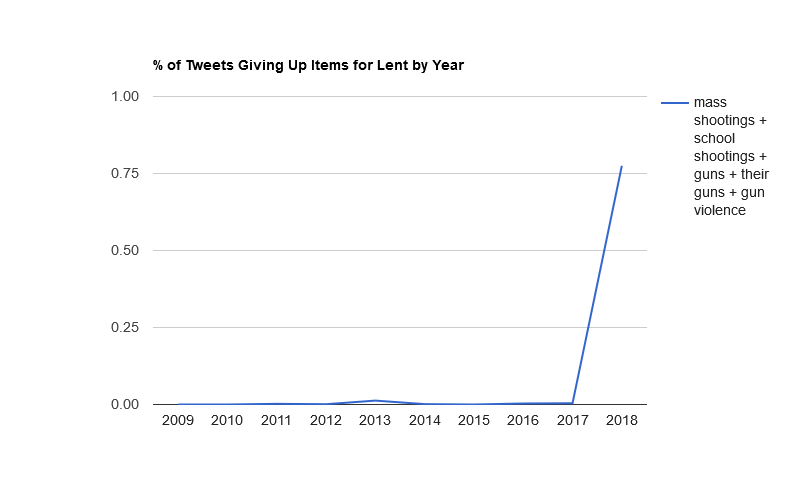
Shootings
Two newcomers to the list this year are #30, guns, and #88, mass shootings. These tweets reflected a shooting at a Florida high school on Ash Wednesday.
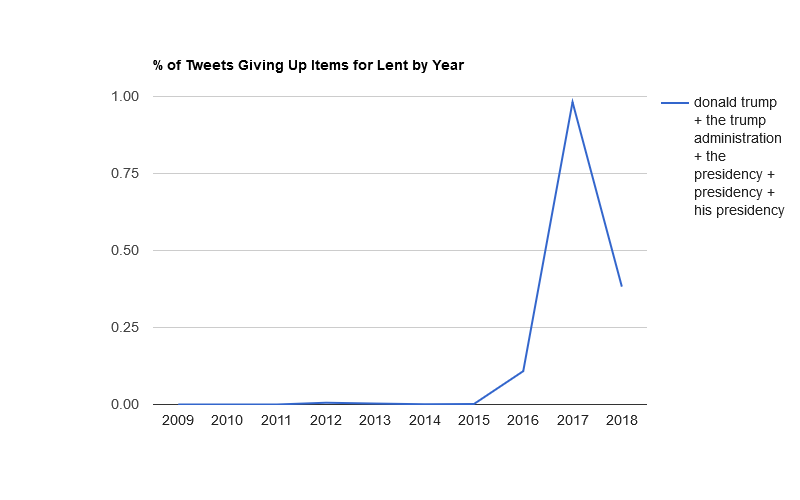
Donald Trump
Donald Trump fell this year from #22 to #67, sandwiched between hope and procrastination.
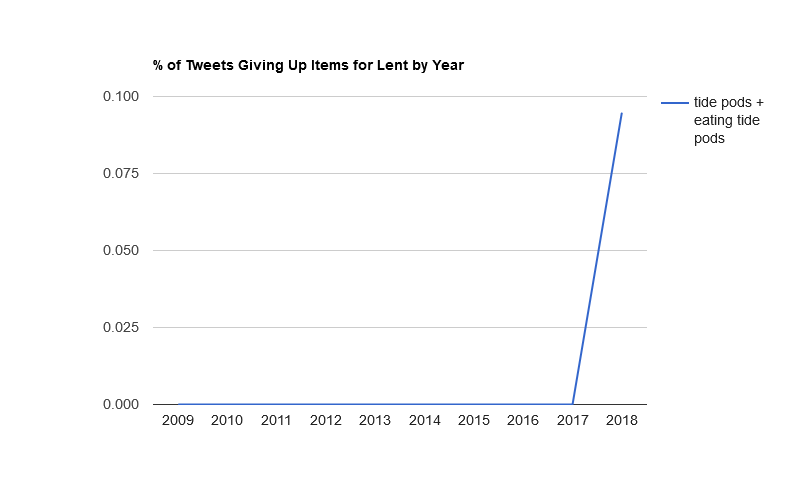
Tide Pods
Finishing just out of the top 100 this year are Tide Pods, which people keep eating for some reason.
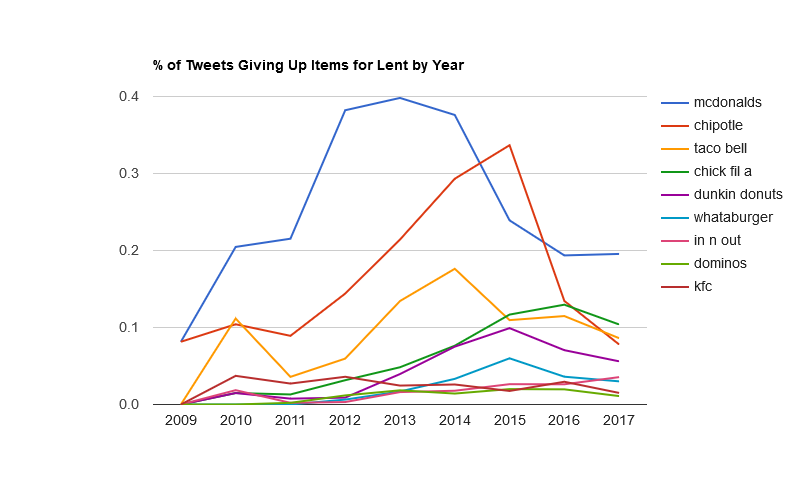
Fast Food
Chick-fil-A surged to near-parity with McDonald’s, while Chipotle this week decided to deal with its Taco Bell parity by hiring Taco Bell’s former CEO.

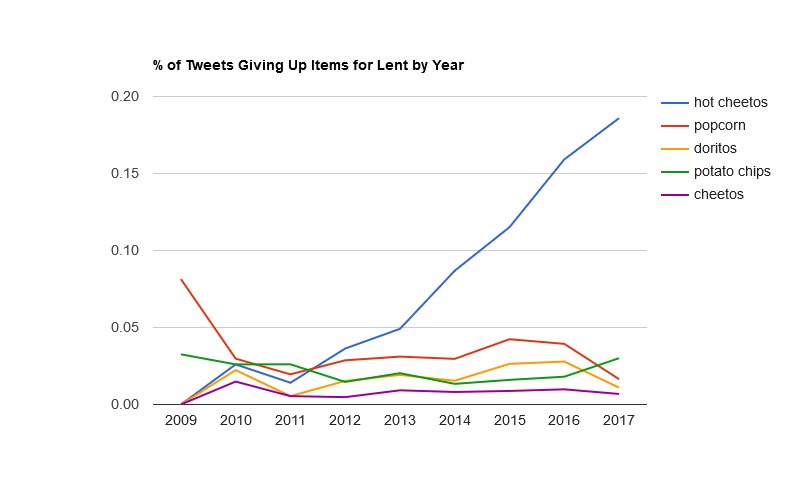
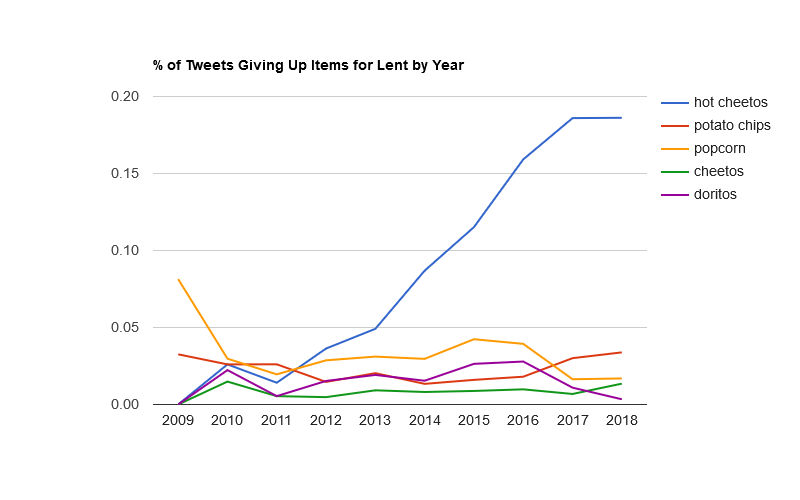
Snack Food
Have Hot Cheetos finally plateaued?
Emojis
This year 4,667 tweets (16%) contained at least one emoji, down from 19% last year. The most-popular emojis were: 😂 😭 ♀ 😩 🙃 🙏 ✌ 😅 🙄 ♂.
Retweets
Here’s the most-retweeted Lent post this year, with over 71,000 retweets. I’m not totally sure why. (All the rest of the data on this page excludes retweets.)
for lent im just giving up
— annie (@annien826) February 13, 2018
Top 100 Things Twitterers Gave Up for Lent in 2018
| Rank | Word | Count | Change from last year’s rank |
|---|---|---|---|
| 1. | Social networking | 1,329 | +1 |
| 2. | 1,215 | +2 | |
| 3. | Alcohol | 1,105 | -2 |
| 4. | Chocolate | 1,035 | -1 |
| 5. | Swearing | 549 | +1 |
| 6. | Meat | 531 | +6 |
| 7. | Sweets | 499 | +3 |
| 8. | Soda | 441 | 0 |
| 9. | Coffee | 387 | +2 |
| 10. | Fast food | 380 | -1 |
| 11. | Lent | 373 | +2 |
| 12. | 342 | +9 | |
| 13. | Sex | 315 | +6 |
| 14. | Bread | 267 | +2 |
| 15. | School | 256 | -8 |
| 16. | Chips | 222 | -11 |
| 17. | Snapchat | 216 | +34 |
| 18. | Beer | 193 | -3 |
| 19. | You | 189 | +1 |
| 20. | Men | 189 | +35 |
| 21. | Plastic | 188 | +122 |
| 22. | Sugar | 185 | -5 |
| 23. | Boys | 165 | +2 |
| 24. | Candy | 162 | +7 |
| 25. | Valentine’s Day | 157 | +130 |
| 26. | Work | 145 | -2 |
| 27. | College | 145 | -13 |
| 28. | Negativity | 144 | +32 |
| 29. | 143 | +13 | |
| 30. | Guns | 141 | +126 |
| 31. | Life | 139 | -13 |
| 32. | Marijuana | 132 | +1 |
| 33. | Junk food | 130 | -6 |
| 34. | Religion | 130 | -8 |
| 35. | Giving up things | 112 | |
| 36. | Starbucks | 111 | -2 |
| 37. | Red meat | 108 | +12 |
| 38. | Cheese | 106 | -6 |
| 39. | Catholicism | 105 | -4 |
| 40. | Pizza | 104 | -11 |
| 41. | Smoking | 100 | -11 |
| 42. | Love | 100 | +96 |
| 43. | Wine | 93 | -3 |
| 44. | Carbs | 91 | 0 |
| 45. | Me | 89 | -7 |
| 46. | Fortnite | 87 | |
| 47. | Lying | 84 | +25 |
| 48. | Dairy | 81 | +13 |
| 49. | Homework | 78 | -21 |
| 50. | Rice | 77 | -7 |
| 51. | Booze | 76 | +12 |
| 52. | Fried food | 75 | -7 |
| 53. | Ice cream | 74 | -17 |
| 54. | Complaining | 72 | +14 |
| 55. | Cookies | 69 | -18 |
| 56. | Single use plastic | 68 | +100 |
| 57. | Shopping | 68 | -11 |
| 58. | People | 66 | -11 |
| 59. | Caffeine | 65 | +11 |
| 60. | Stuff | 60 | -10 |
| 61. | Masturbation | 59 | +3 |
| 62. | Liquor | 58 | -5 |
| 63. | F***boys | 58 | -24 |
| 64. | Takeout | 57 | -4 |
| 65. | Sobriety | 57 | -9 |
| 66. | Hope | 57 | -43 |
| 67. | Donald Trump | 56 | -46 |
| 68. | Procrastination | 56 | -13 |
| 69. | Virginity | 55 | -21 |
| 70. | McDonald’s | 55 | -8 |
| 71. | Hot Cheetos | 55 | -5 |
| 72. | French fries | 53 | -20 |
| 73. | Netflix | 53 | -8 |
| 74. | Fizzy drinks | 49 | +3 |
| 75. | Chick Fil A | 48 | +4 |
| 76. | Eating out | 48 | -10 |
| 77. | Makeup | 47 | -32 |
| 78. | Porn | 47 | +21 |
| 79. | Myself | 45 | -3 |
| 80. | Juuling | 45 | |
| 81. | Him | 44 | -7 |
| 82. | Pasta | 44 | -3 |
| 83. | Desserts | 41 | -14 |
| 84. | Food | 40 | -25 |
| 85. | Coke | 40 | -14 |
| 86. | Pork | 39 | +17 |
| 87. | Dating | 38 | +23 |
| 88. | Mass shootings | 38 | |
| 89. | Sleep | 38 | -16 |
| 90. | Breathing | 37 | -47 |
| 91. | Boba | 37 | +3 |
| 92. | Being single | 36 | +22 |
| 93. | Cake | 36 | -6 |
| 94. | My will to live | 36 | -36 |
| 95. | Pancakes | 36 | -15 |
| 96. | The presidency | 35 | -43 |
| 97. | Online shopping | 32 | -15 |
| 98. | Tea | 31 | +10 |
| 99. | Brexit | 30 | +27 |
| 100. | This | 30 | -5 |
| 101. | TV | 30 | -5 |
Top Categories
Unlike previous years, no non-political celebrities inspired large numbers of people to give them up.
| Rank | Category | Number of Tweets |
|---|---|---|
| 1. | food | 6,702 |
| 2. | technology | 3,556 |
| 3. | habits | 2,034 |
| 4. | smoking/drugs/alcohol | 2,027 |
| 5. | relationship | 1,339 |
| 6. | irony | 946 |
| 7. | school/work | 714 |
| 8. | sex | 568 |
| 9. | religion | 404 |
| 10. | politics | 252 |
| 11. | generic | 224 |
| 12. | possessions | 155 |
| 13. | entertainment | 149 |
| 14. | shopping | 147 |
| 15. | health/hygiene | 125 |
| 16. | money | 94 |
| 17. | sports | 53 |
| 18. | weather | 21 |
| 19. | clothes | 14 |
Media Coverage
The Lent Tracker received some media attention this year: