Blog RSS Feed

Archive for the ‘Visualizations’ Category

Phrase Net Bible Visualizations

Wednesday, March 25th, 2009

The social data visualization site Many Eyes just unveiled a new visualization type, the Phrase Net, which illustrates phrase connections in textual content. The hard part is finding the right phrase to produce a good visualization.

Here are a couple of visualizations of the Old and New Testaments in the KJV Bible, using the pattern “[word] of [word].”

Old Testament

The Old Testament visualization illustrates the centrality of ideas like “Children of Israel,” “King of Israel,” and “Land of Israel.”

See the Old Testament visualization at Many Eyes (requires Java)

New Testament

The New Testament visualization shows the shift in emphasis to “Son of God” and “Kingdom of God.”

See the New Testament visualization at Many Eyes (requires Java)

Both visualizations require Java.

Edit July 2015: IBM has closed Many Eyes, so the above links to the interactive visualizations no longer work.

Top 100 Things Twitterers Are Giving Up for Lent

Friday, February 27th, 2009

A Wordle of the below words shows the relative frequency of each one.

Some you’d expect (alcohol, chocolate), some are ironic (giving up Lent for Lent, giving up giving up things), some are odd (pants, lint), some are anti-religious (religion, Catholicism), and some are tech-related (Facebook, Twitter—even “Facebook and Twitter” makes the list).

Complete List

  1. Facebook (654)
  2. Twitter (317)
  3. Chocolate (272)
  4. Lent (216)
  5. Alcohol (187)
  6. Soda (139)
  7. Coffee (129)
  8. Meat (126)
  9. Religion (102)
  10. Swearing (94)
  11. Sweets (92)
  12. Catholicism (90)
  13. Giving up things (80)
  14. Work (70)
  15. Beer (60)
  16. Sex (59)
  17. Fast food (57)
  18. Facebook and twitter (57)
  19. Sugar (45)
  20. Stuff (43)
  21. Booze (41)
  22. Smoking (39)
  23. Food (39)
  24. Procrastination (38)
  25. Internet (37)
  26. Cursing (36)
  27. Caffeine (35)
  28. TV (33)
  29. Pancakes (33)
  30. Social networking (33)
  31. Sleep (32)
  32. Candy (32)
  33. Diet Coke (29)
  34. Giving up (29)
  35. You (28)
  36. Wine (28)
  37. Lint (28)
  38. Cheese (28)
  39. Bread (26)
  40. Shopping (26)
  41. Sobriety (26)
  42. Abstinence (24)
  43. Cussing (24)
  44. Red meat (24)
  45. Chips (23)
  46. Internet porn (22)
  47. Christianity (22)
  48. Nothing (21)
  49. French fries (21)
  50. Jesus (21)
  51. Sarcasm (19)
  52. Junk food (19)
  53. Starbucks (18)
  54. Ice cream (18)
  55. MySpace (18)
  56. Cookies (18)
  57. Fried food (17)
  58. Complaining (17)
  59. God (16)
  60. New years resolutions (15)
  61. Social media (15)
  62. Pizza (14)
  63. Tweeting (14)
  64. Carbs (13)
  65. MySpace and Facebook (13)
  66. Carbon (13)
  67. Eating out (13)
  68. Stress (13)
  69. Flaky guys (12)
  70. Laziness (12)
  71. Texting (12)
  72. Me (11)
  73. Some of your money (11)
  74. Annoying me (11)
  75. Sacrifice (11)
  76. School (11)
  77. Hope (10)
  78. Rice (10)
  79. Coke (10)
  80. Porn (10)
  81. The snooze button (10)
  82. Guilt (10)
  83. Men (9)
  84. Obama (9)
  85. Church (9)
  86. My job (9)
  87. Homework (9)
  88. Self denial (9)
  89. Moderation (9)
  90. Exercise (8)
  91. Bacon (8)
  92. Dieting (8)
  93. Paying taxes (8)
  94. Dr Pepper (8)
  95. Gossip (8)
  96. Beef (8)
  97. Pants (7)
  98. My sanity (7)
  99. Celibacy (7)
  100. Shaving (7)

About

Created using the Twitter Search API and Wordle. Data based on analysis of 15,000 tweets from February 22-26, 2009.

New Feature: Bible Verse Photo Composites

Monday, February 4th, 2008

Try Bible Verse Photo Composites. Move your mouse over the image to see a photo composite for a particular verse, and click to see composites for the words in that verse.

An example:
Genesis 1:1 shows images over the words “beginning,” “God,” “created,” “heavens,” and “earth.”

Here’s the idea: Use the Flickr API to find photos matching each of the words in the Bible. Then download the photos for each word and layer them on top of each other to produce a composite image for word. Once you do that, layer the important words from each verse on top of each other to produce a composite image for each verse.

Then put all the verses together in sequence to create the orangeish image you see above. About 300,000 images comprising 13,000 words make up the image. Each verse occupies about six pixels.

Technical Background

For layering the photos, I wanted the brightest (most-saturated) colors possible; I used a simple formula. It finds the difference between the brightest and darkest channels in a particular pixel. The brighter colors will tend have bigger differences.

function weight_pixel($pixel)
{
$rgb = array(( $pixel >> 16 ) & 0xFF, ( $pixel >> 8 ) & 0xFF, $pixel & 0xFF);
sort($rgb, SORT_NUMERIC);
return $rgb[2] - $rgb[0];
}

This formula differs from the usual conversion formula from RGB to HSL. I didn’t like the results of the RGB-HSL formula as much; the images were slightly darker.

Then I placed the darkest pixels on the bottom layer of the composite image, layering brighter (but about 50% transparent) pixels on top. The results for each word resemble abstract art:

11 (11) begrudge (begrudge) liquid (liquid) sharp (sharp) waterfalls (waterfalls)

I did a similar procedure to produce verse composites, layering the important words from each verse on top of each other. The results are generally less spectacular (in my opinion) than the word composites, as many of the verses look like each other. I’d like to explore other compositing algorithms to try to differentiate the verses more. (Feel free to leave a comment if you have any suggestions for an algorithm!)

Gen 1:2 (Gen 1:2) Josh 3:10 (Josh 3:10) Matt 5:4 (Matt 5:4)

The hardest part was the waiting. It took a long time to download the 300,000 images, and nearly as long to process them all. Plus, it takes a while to upload half a gigabyte of data after processing the images.

The verses composites omit images for about 200 common words (as listed in the Crossway Comprehensive Concordance of the ESV). I didn’t want common words to overwhelm the important ones.

From a coding standpoint, this project let me try out the jQuery Javascript library, which I’ve been wanting to do for some time.

Future Directions

Well, the result is awfully orange. As I said above, I would’ve liked to see some more differentiation. (I tried a few different formulas but didn’t come up with anything that works much better.) You can see some bands that are more orange than others, but I’m not sure how significant they are.

It would be interesting to try to calculate cross-references based on the similarity of the verse composites—are verses that look alike actually similar?

Any work of literature would lend itself to this kind of project. Project Gutenberg has lots of public-domain e-texts available. It would be interesting to compare the composite footprint of, say, Moby Dick to the Bible’s.

Inspiration

The inspiration for this project comes from the 80 Million Tiny Images project by Antonio Torralba, Rob Fergus, and William T. Freeman at MIT. They created a map of nouns in the English language by downloading images from search engines, combining the images, and then arranging them into a graphic based on the words’ semantic distance from each other. Fascinating stuff. Via ReadWriteWeb.

Google Timeline View of Biblical Events

Tuesday, January 29th, 2008

Google just introduced an experimental view of search results that identifies dates embedded in webpages and shows you a timeline of when these pages say the relevant events occurred.

Below are searches for a few events in the Bible. Obviously the timelines reflect divergent opinions on when the events occurred.

Jesus’ Birth

See the results for Jesus’ birth on Google.
The current consensus seems to be sometime in 2 B.C.

Jesus’ Crucifixion

See the results for Jesus’ crucifixion on Google.
The year A.D. 30 is the clear leader here. Notice how most of the bars in the first few months of the year, which you’d expect if the Crucifixion coincided with Passover.

The Exodus

See the results for the Exodus on Google.
Here you see the two main datings of the Exodus: the 15th century and the 13th century B.C.

Via Searchblog.

Update February 2016: At some point, Google discontinued this offering, so the above links to Google no longer work.

3D Cross-References

Tuesday, October 23rd, 2007

Somewhat related to the long zoom and new ways of viewing the Bible, here’s a 3D program for viewing relationships among documents:

Eleven documents in a three-dimensional representation show links between their parts.

This image comes from Xanadu.com (where there are more pictures). It shows transclusions, or (to oversimplify things) places where documents quote each other.

The Bible and biblical reference works do this kind of quoting and referencing all the time—for example, commentaries cite passages and external sources to support their interpretations. Current-generation Bible software makes it easy to work your way through different citations, but it’s hard to see the extended context of multiple citations at one time. A more visual interface might let you make connections you otherwise wouldn’t.

Via if:book.

The Long Zoom

Friday, October 12th, 2007

Sean at Blogos (finally) reveals the topics of his presentations at the BibleTech08 conference.

One of his talks is about the “long zoom” (which, shockingly, lacks a Wikipedia entry) as it relates to studying the Bible. Over the past year, I’ve become convinced that the long zoom is a fundamental metaphor for how people deal with complexity (especially now, in the early 21st century) and that the Bible software company that successfully applies the long zoom to its products will redefine Bible study.

What Is the Long Zoom?

The long zoom refers to the idea of showing objects or data at different scales. Think of zooming in and out on Google Earth, for example—one second you see the whole earth, the next you’re looking at the nonexistent logo at the bottom of Google’s swimming pool. As Sean mentions, the film Powers of Ten (1977) was the first project to express the idea in an accessible way.

But the term “long zoom” comes (I think) from an article in the New York Times Magazine by Steven Johnson called The Long Zoom. The article is about the (still ongoing) development of the computer game Spore by Will Wright, who created SimCity. Jason Oke summarizes the article if you don’t want to read all 5,000 words of it. (I recommend reading the whole thing, however. It’s one of the most interesting articles I’ve read, though it probably helps to have enjoyed playing SimCity at some point in your life.)

Johnson writes:

“One of the things that’s obviously been happening for the past 100 or 200 years,” [musician Brian] Eno told me, “is that the range of our experience has greatly expanded: we can see much smaller things and much bigger things than we ever could before. But we can also start thinking about much longer futures and much deeper pasts as well. That really makes a big difference to us as humans, because on the one hand it makes us realize that we’re very powerful in that we’re able to comprehend and see all of this universe. But it also makes us seem so much less significant. We’re a tiny blip on a tiny radar screen. I think this is a feeling that people are trying to come to terms with, the feeling of where do we fit in all of this.”

And arguably the best way to come to terms with that feeling is to explore those different scales of experience directly, to move from the near-invisible realm of microbes to the vast distances of galaxies. Of all the forms of culture available to us today, games may well be the most effective at conveying that elusive perspective, precisely because they are so immersive and participatory and because their design can be so open-ended. “I wanted to make a game that would recreate a drug induced epiphany,” Wright told me. “I want people to be able to step back five steps, five really big steps. To think about life itself and its potential galactic-scale impact. I want the gamers to have this awesome perspective handed to them in a game. And then let them decide how to interpret it.”

(Wright is, of course, describing the effects of not just drug trips but also how great works of art—music, literature, visual arts, and now, apparently, video games—have always affected people: art catches people by surprise and gives them a glimpse of their humanity or perhaps even a longing for something more than is possible in our limited existence on earth. But I don’t need to get into a theology of art here.)

Both Eno and Wright frame their comments from a long-zoom perspective, a perspective that, as Eno notes, only recently became possible to visualize concretely. Any medium that allows interactivity or animation has the potential to express itself in long-zoom terms—in other words, film and computers are the ideal media to explore the long zoom.

In his summary of the article, Oke writes:

the long zoom helps us see how things at different scales, from the littlest things to the biggest, are interconnected…. This idea of seeing relationships across different scales is an immensely useful and important idea… But more specifically, what the long zoom visually demonstrates is what you could call the verticality of interconnectedness—not just connections between peers or similar things, but the connections between things at different scales, between the small and the huge. Scale can seem to impose its own limits— it’s easy to assume that small things should have small effects, big things should have big effects. But the long zoom helps us see that small things can have big effects.

Because seeing patterns across scales is so new, and only possible with technology, it presents novel ways of studying the Bible.

Applications for Bible Software

The main way I imagine long zoom working is textually—showing relationships at different levels: words, clauses, sentences, paragraphs, sections, books, the whole Bible, historical and contemporaneous literature, and future literature. In other words, it makes explicit the implicit context at each scope and between scopes, showing how parts relate to the whole and how seemingly independent ideas actually couldn’t exist without each other. (It sounds a lot like a semantic dataset, I know.) I don’t realistically think we can identify all the links between ideas at every level—we’re not omniscient—but we should be able to identify some of the important ones. I also think that as people and scholars become more adept at finding links at different scopes, as they think more explicitly in long-zoom terms, they’ll start to see entirely new patterns emerge.

I realize that paragraph is pretty abstract. Sorry.

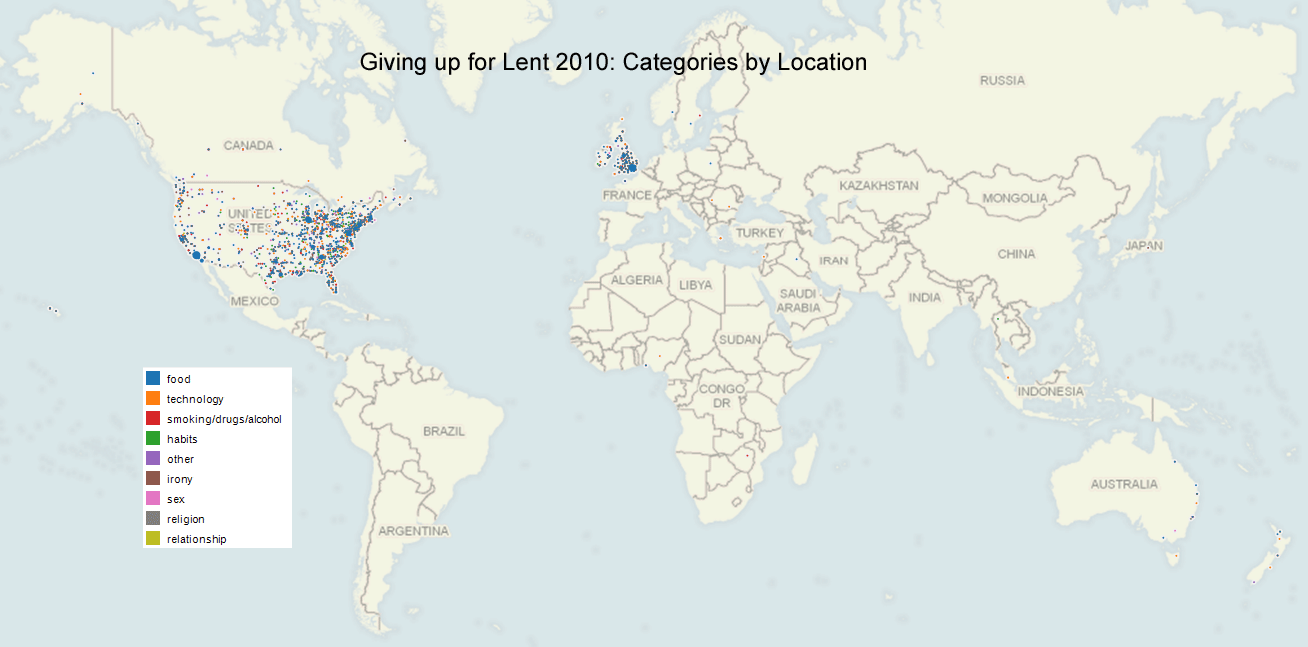
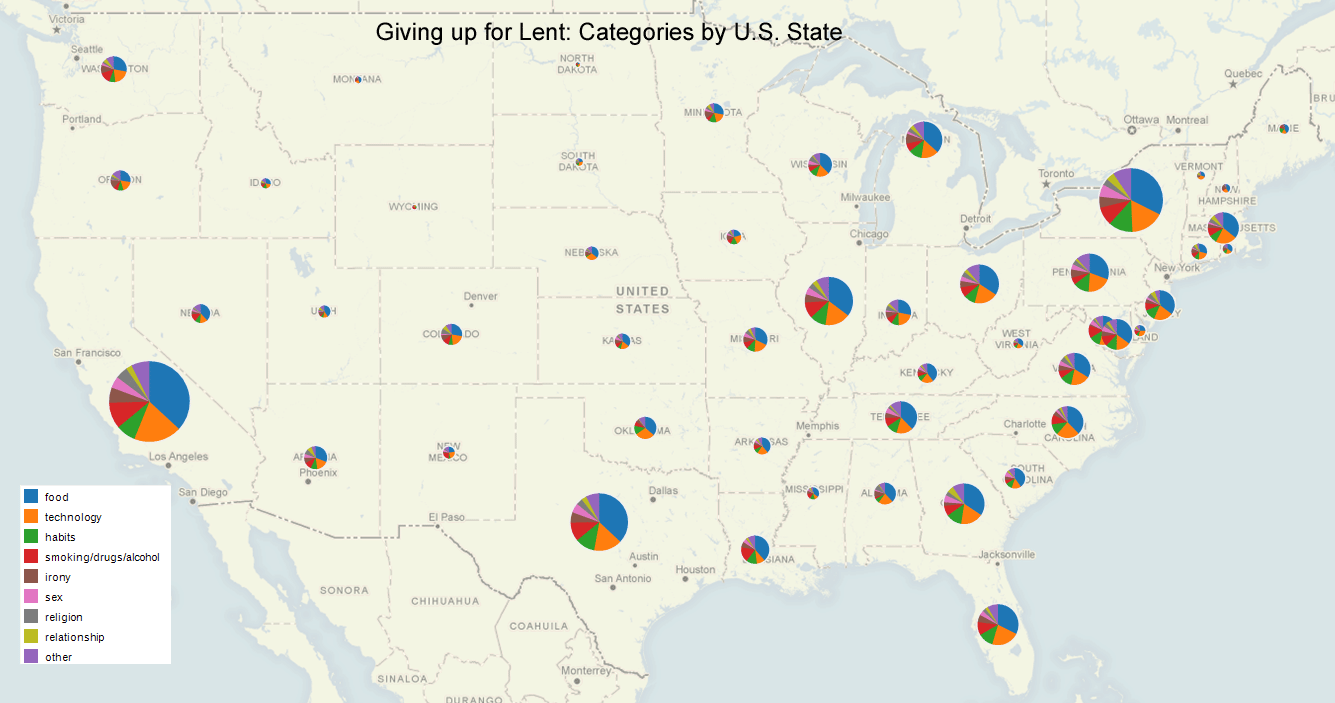
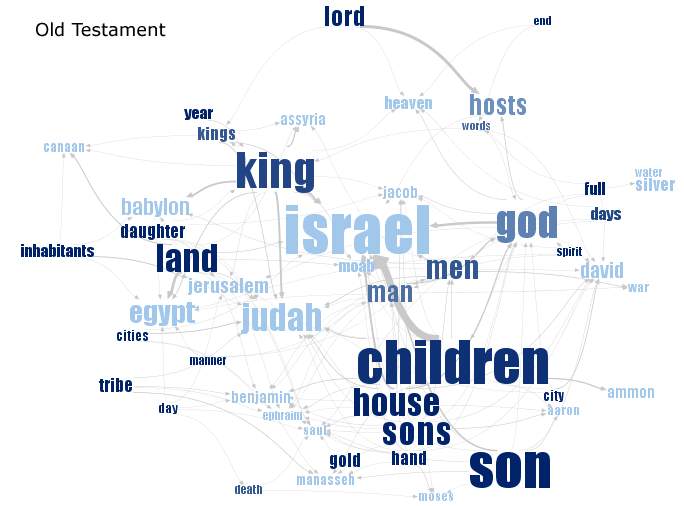
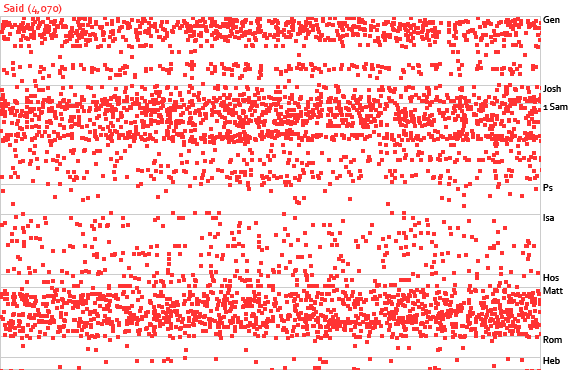
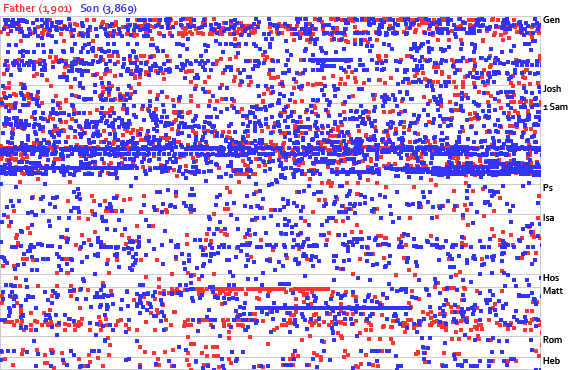
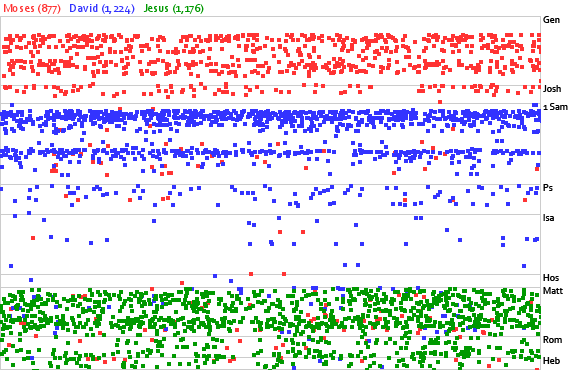
Think of the Bible Word Locator as one component in a long-zoom system. It lets you see the distribution of multiple words at a time across the whole Bible. Adding scoping would let you zoom in to see occurrences at the book or verse level, for example, and zoom out to see occurrences across Bible translations, perhaps, or other ancient books, or other religions. Current Bible software lets you search this way to some extent, but it doesn’t let you do it with the fluidity of a long-zoom interface—an interface that allows you to see all these different levels and move between them with ease.

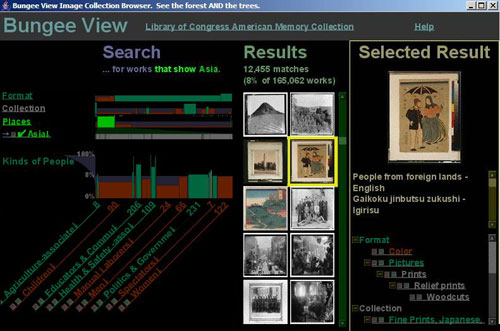
Another example of a tool that lets you work on multiple scales simultaneously is Carnegie Mellon’s Bungee View, designed for navigating the vast photo collections of the Library of Congress and similar institutions. It doesn’t explicitly use the zooming metaphor, but its motto is: “See the forest AND the trees,” which sums up well the whole long-zoom idea:

Go to the Bungee website.

Of course, textual study is only one way to apply the long zoom to the Bible. Other organizing principles are time, space, people, God’s redemptive plan for humanity, the Ten Commandments, echoes of Christ throughout the Bible—you can see pretty much anything through a long-zoom filter, which is both good and bad.

It’s easy (for me, anyway) to become enamored with the sheer novelty of seeing Bible data in different ways and to press the long-zoom metaphor too far. If I say that the long zoom is the interpretive key to the whole Bible, I’m no better than numerologists who find the secret of life in the 153 fish in a fishing net. The long zoom is a new way of seeing data, one that fits the current state-of-the-art well, but there many other ways of looking at the data, too.

You need raw data to produce any kind of visualization (long-zoom or otherwise). Part of what I’m doing here at OpenBible is providing reusable data that people can use to create really cool things like long-zoom interfaces. Similarly, Sean is working on organizing Bible data for Logos to enable the “zoomable user interface” for them.

I hope that Sean is planning to publish the slides from his talk—it sounds like a fascinating new approach to studying the Bible, and I’m eager to see what he’s come up with.

New Tool: Bible Word Locator

Monday, September 3rd, 2007

Try it out.

Screenshots

See ‘said.’
All the occurrences of the word said in the Bible. Note the narrative bands in Genesis, the Old Testament history books, and the gospels.

See ‘father’ and ‘son.’
Occurrences of the words father and son. Clusters in Chronicles and a couple of places in the New Testament show where to find the genealogies.

See ‘Moses,’ ‘David,’ and ‘Jesus.’
Occurrences of the words Moses, David, and Jesus. It’s easy to tell where the main stories about each person are.

Background

Part of the Similar Diversity work includes a visualization of the word you in various holy books. This visualization provided me the impetus to produce something more interactive for the Bible.

How It Works

First, I counted the number of words in the ESV Bible (767,847, including headings but excluding footnotes, if you’re interested).

Next I assigned each word in the Bible a unique, incremented number. Then it was just a matter of going through the positions and grouping them by word. The result is a database table with two columns: word (varchar(18)) and positions (mediumtext). The positions column consists of a space-separated string of numbers.

When you enter a search query, the program finds the positions of words matching your query and then plots those positions on a chart. (The chart is 1/4 the size it would be if each word position got one pixel; it would have to be 1,083×709 pixels at a one-pixel-per-word ratio.)

The Code

The code is in PHP, using the GD library. I decided this project would be a good time to try out the SQLite database that comes with PHP instead of going with MySQL. I have no complaints, though Perl creates incompatible tables with current PHP versions (5.2.4) unless you use PDO in PHP to access the tables. It worked fine after a bit of Googling revealed the workaround.

Limitations

Since the chart is 1/4 full-size, each pixel represents four words, and each dot occupies nine pixels. Given the coarse resolution, it’s best to use the locator to identify trends and then switch to the Bible text for further analysis.

It doesn’t do exact matches, only beginning-of-word matches. Only want to search for Eve, omitting results for evening? You’re out of luck.

It would be interesting to be able to click a dot and see the context of each occurrence.

Introducing Labs

Launching this tool gives me an excuse to launch the new Labs section of this site, which houses small, one-off experiments like this one and the Chapter Browser.

Visualization: Genesis Word Trees

Saturday, September 1st, 2007

From Many Eyes (Java required), a word tree of “God said” from Genesis:

Many Eyes is a data-visualization site. They just introduced a word-tree visualization, which takes a body of text and lets you find phrases surrounding a word. One of the creators of the site uploaded this data set for Genesis (KJV). Create your own visualizations (like the one above) from this data at the site.

An interesting addition would be to let you enter more than one node. For example, entering “God” and “Abraham” would show you all the different words and phrases that connect those two words.

Visualization: Character Relationships across Religions

Friday, August 31st, 2007

From SimilarDiversity.net:

A list of characters (‘Lord,’ ‘God’, and ‘You,’ are the most prominent) runs along the bottom, with arcs connecting them.

This visualization, by Philipp Steinweber and Andreas Koller, comes from the textual analysis of different religions’ holy books (red = Hinduism, yellow = Buddhism, green = Islam, blue = Judaism, purple = Christianity). Below each character is a list of verbs associated with him or her in each religion.

Their intent is (presumably) to show the commonalities among the different religions; I’m more interested in the technique behind the visualization itself. You could, for example, apply the technique to just the Bible and end up with a similar visualization. You could even do a similar color-coding, except with the Old and New Testaments.

Via Infosthetics, which has a few more examples of biblical visualizations in the comments. Tim Regan of Microsoft notes, “The whole area of abstract visualizations of books seems to be growing, and the bible seems to be a good testbed for these projects.”