As I write this post, with about 593 tweets analyzed, perennial favorites “alcohol,” and “twitter,” and “social networking” lead the list. I expect to see tweets this year related to the global pandemic. And will TikTok make the top ten this year?
Look for the usual post-mortem on February 20, 2021.
Posted in Lent | Comments Off on Track in Real Time What People Are Giving Up for Lent in 2021
This year alcohol topped the list for the first time since 2017, followed by social networking and Twitter. New to the top 100 this year are “trolling” (#14) and “being toxic” (#94), following Pope Francis’s call to give up online insults. Also new are “TikTok” (#33), “simping,” or acting obsequiously on TikTok (#41), “coronavirus” (#73) (related: shaking hands), and “the streets” (#95).
This year’s list draws from 35,817 tweets out of 540,684 total tweets mentioning Lent.
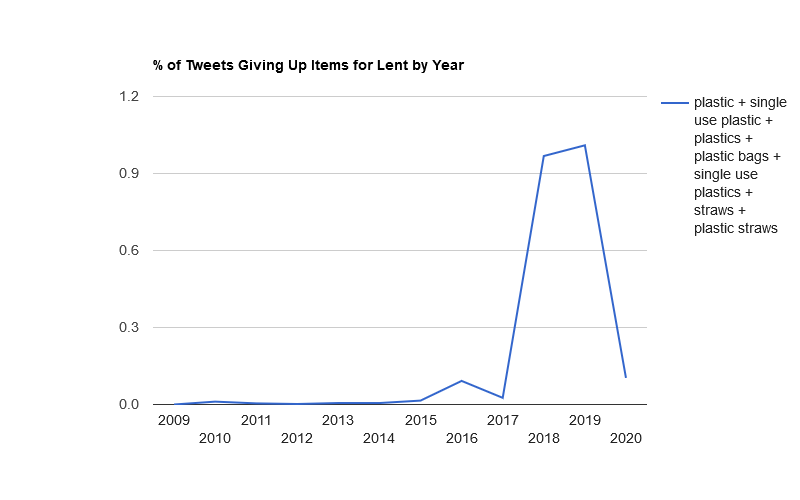
Plastic
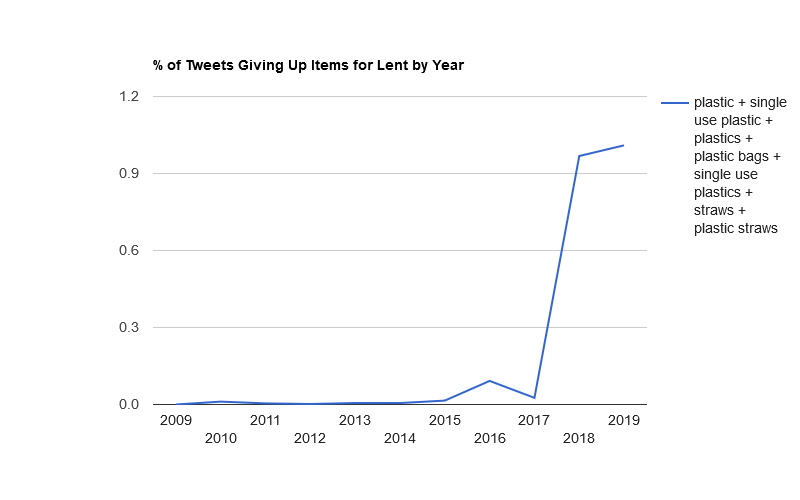
Plastic has been appearing near the top of the list for the past two years as some churches, especially in the UK, have encouraged people to give it up for Lent. This year, mentions of plastic fell precipitously, suggesting that either giving it up has become less fashionable or that people inclined to give it up already did so over the past two years. In particular, “straws” received no mentions.
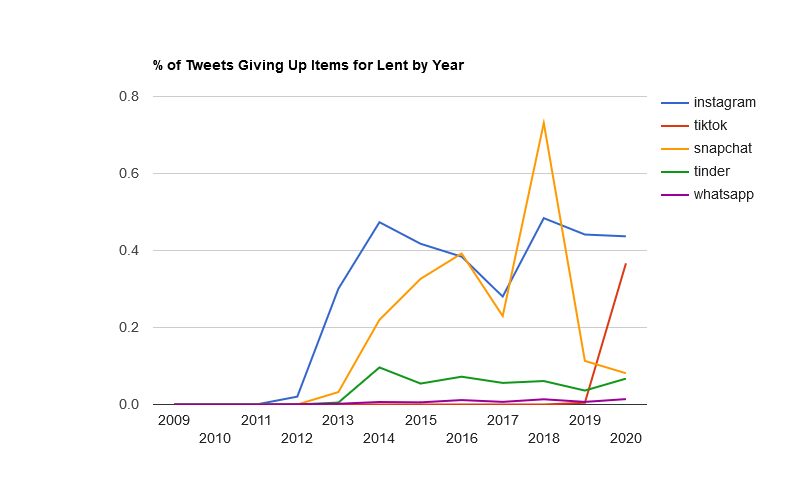
Social Media
As noted above, TikTok is the big winner here.
Fast Food
Chick-fil-A continues its march upward, while McDonald’s continues its decline.
Top 100 Things Twitterers Gave Up for Lent in 2020
As I write this post, with about 1,200 tweets analyzed, perennial
favorites “social networking,” “alcohol,” and “twitter” lead the list. I’ve already learned a new word: simping, “the type of person who, instead of trying to attract the opposite sex through being attractive and interesting, is more sycophantic and fawning,” commonly on TikTok. It’s currently at #12, though I assume it will fall as more people start posting.
Look for the usual post-mortem on March 1, 2020.
Posted in Lent | Comments Off on Track in Real Time What People Are Giving Up for Lent in 2020
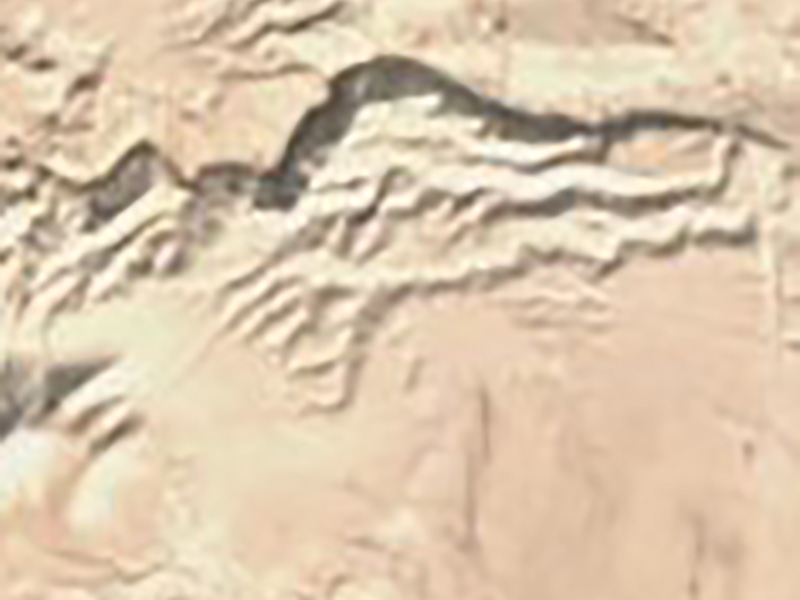
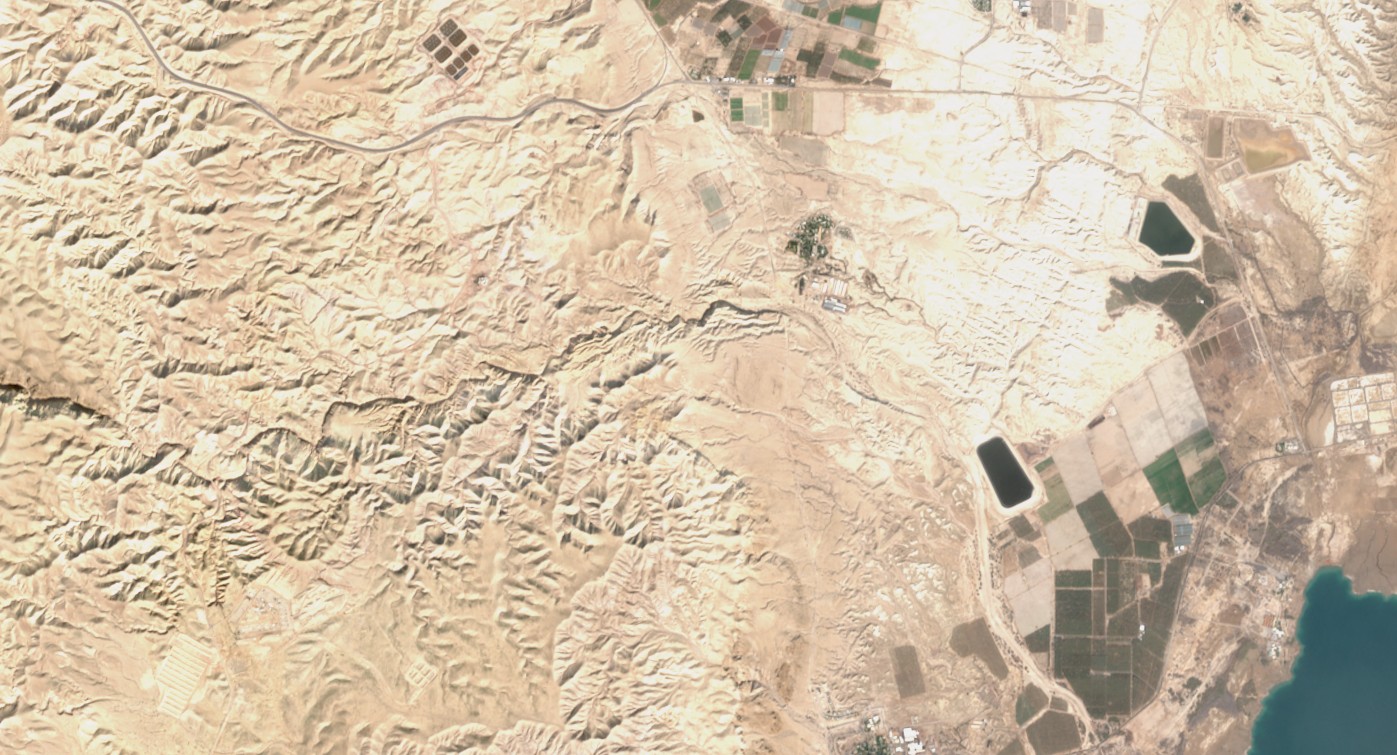
In previous posts, I talked about using a digital terrain model for high-resolution Bible maps and using AI to increase the resolution of satellite photos. In this post, I’ll talk about how you can use old black-and-white but high-resolution satellite photos to enhance lower-resolution modern satellite photos, converting this:
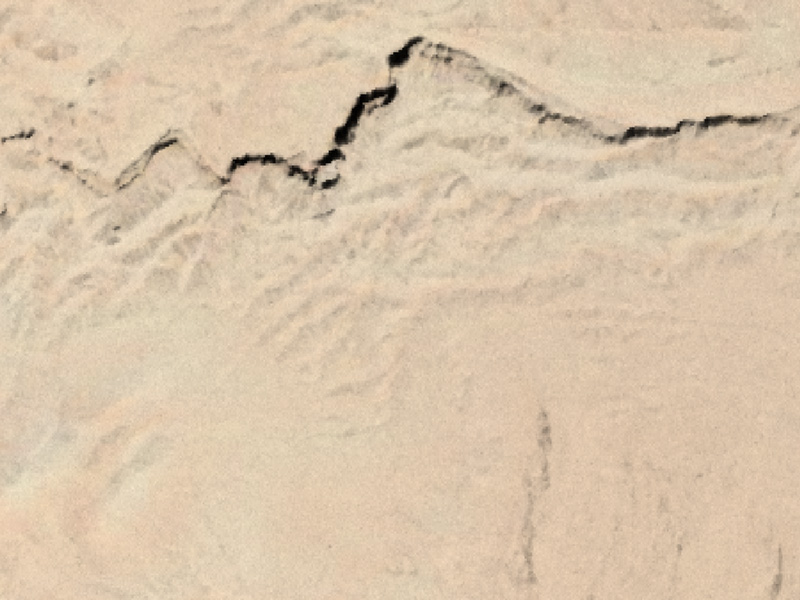
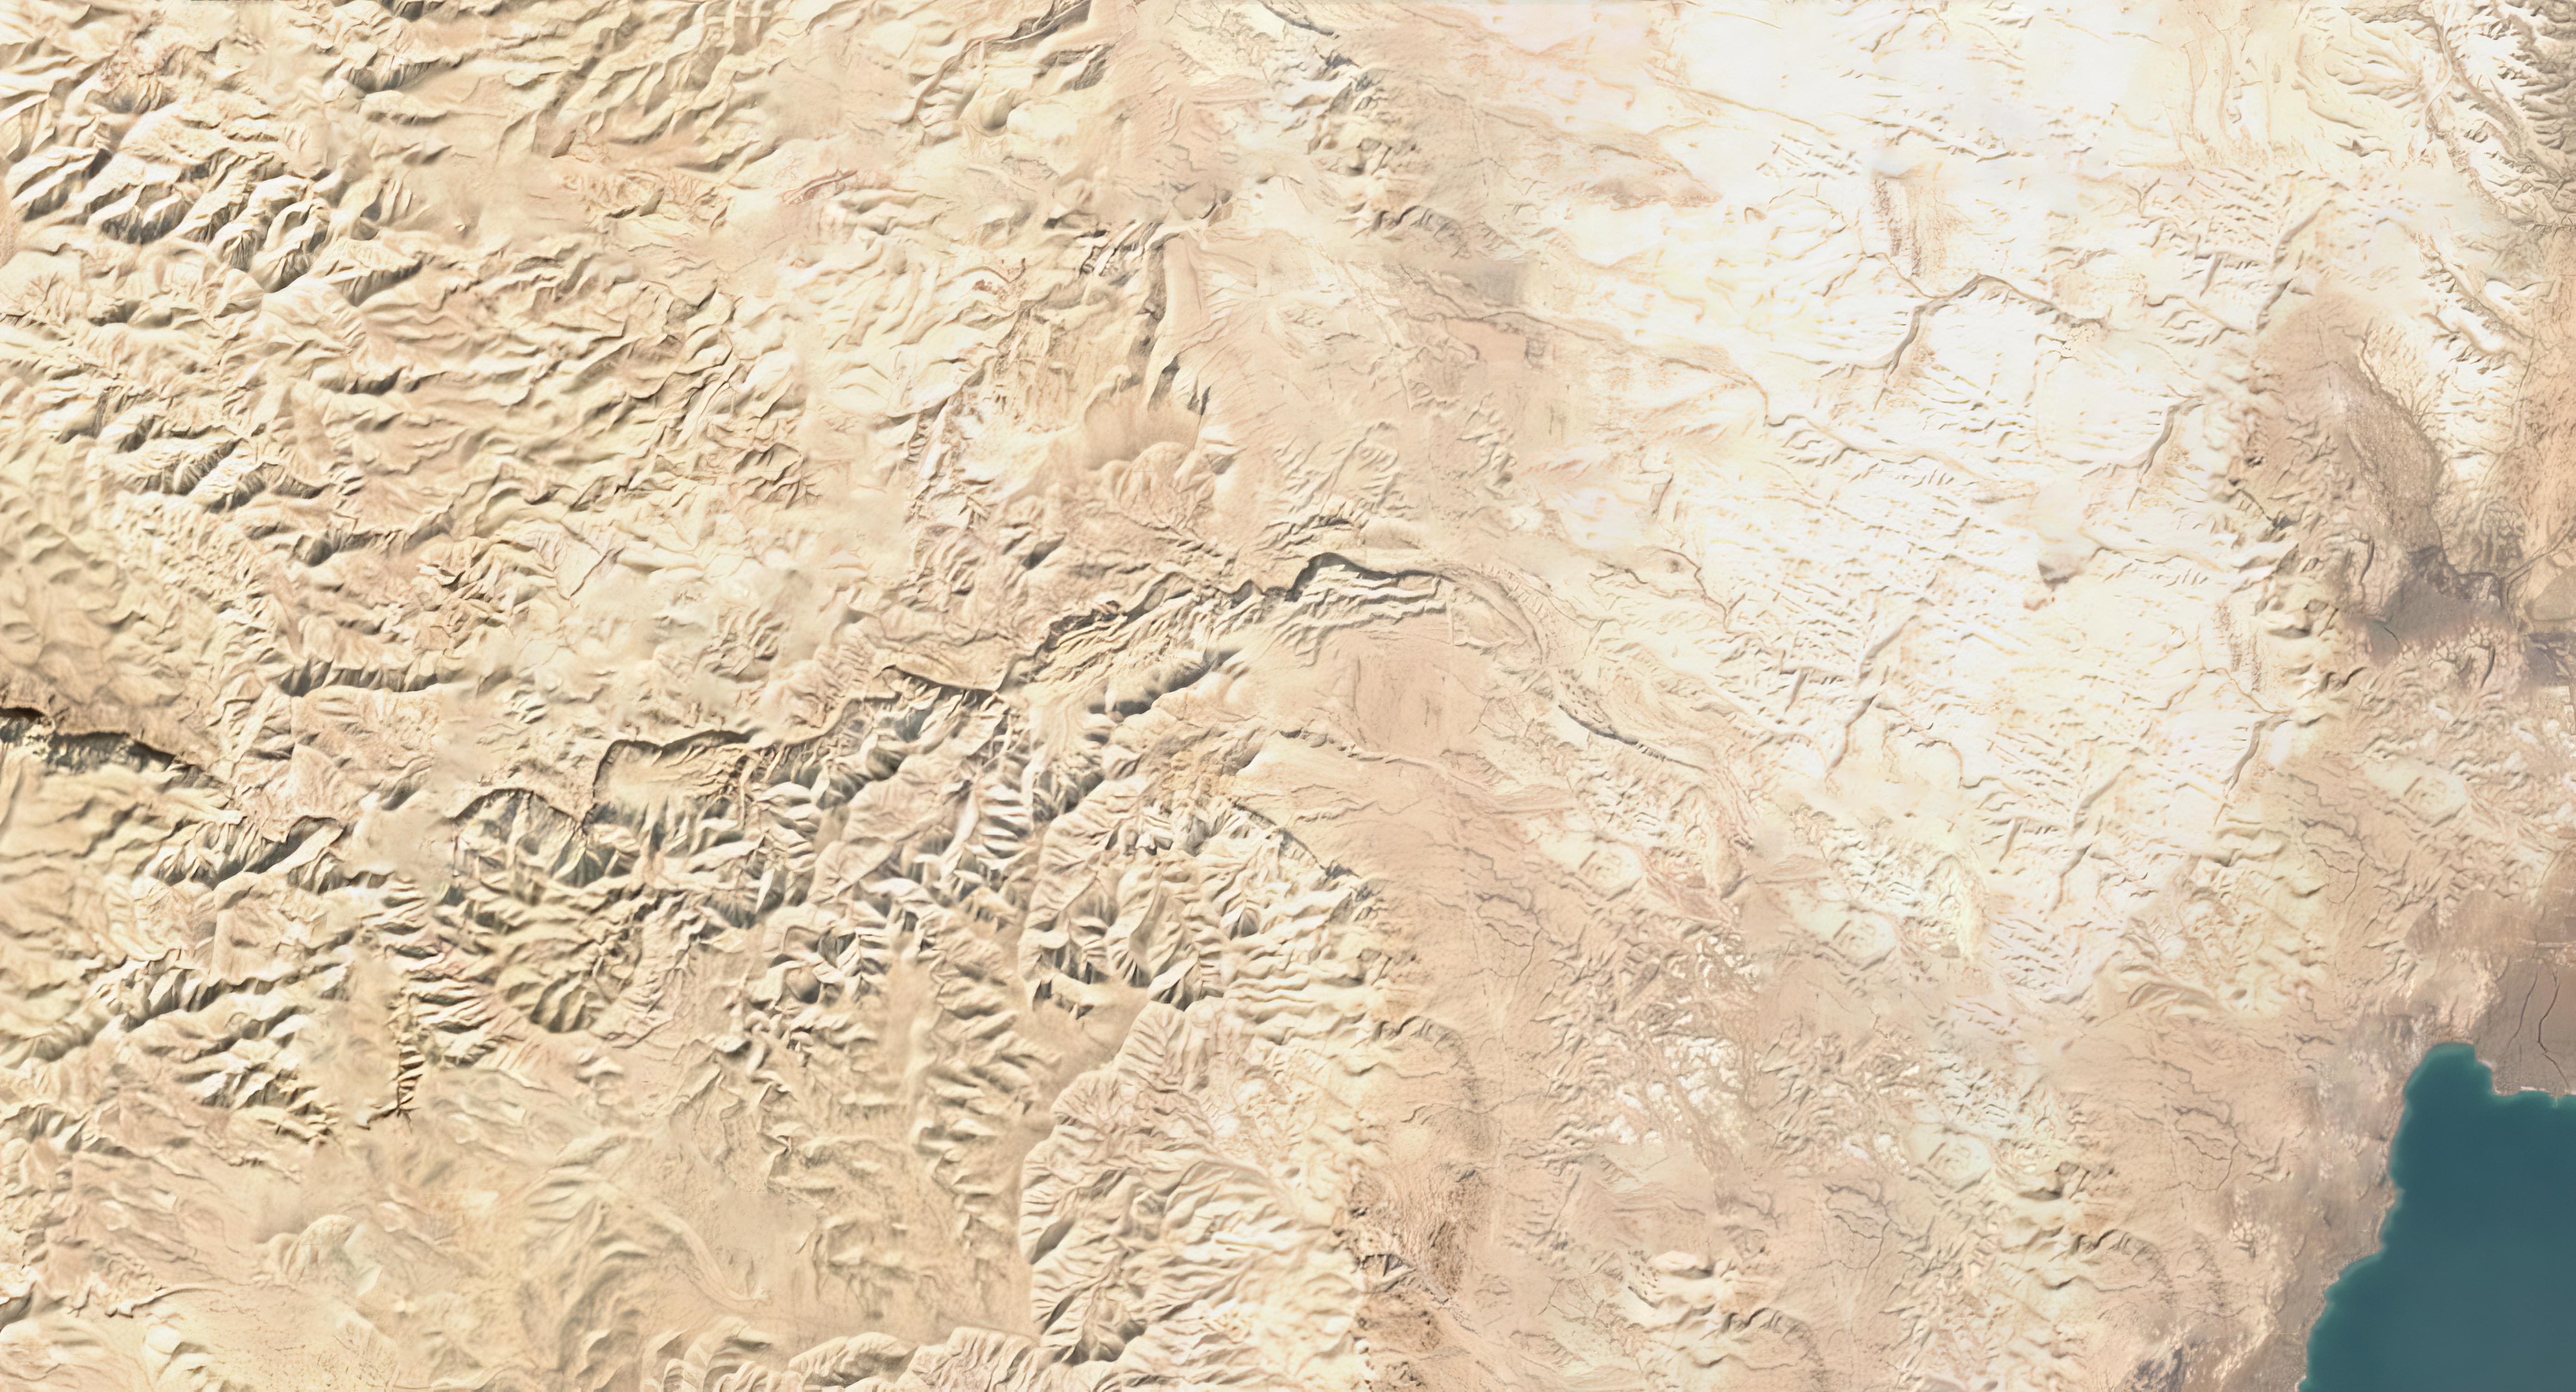
to this:
In 1995, President Clinton declassified images taken by Corona spy satellites from 1959 to 1972. These satellites operated at a resolution of up to six feet (around two meters) per pixel, a big improvement over the ten-meter imagery that the current free-and-highest-resolution Sentinel-2 program provides. However, the high-resolution Corona imagery is black-and-white, while the lower-resolution Sentinel imagery is in color. What if it were possible to combine the two?
Not only is it possible–it’s a common practice called pansharpening that you often see (unknowingly) in satellite imagery. The Landsat 8 satellite, for example, takes color pictures at a thirty-meter resolution and black-and-white pictures at a 15-meter resolution; when you combine them, you get a fifteen-meter output.
So if you take the ten-meter Sentinel imagery and pansharpen it with two-meter Corona imagery, you get something like the above image. I combined these images by hand using GDAL Pansharpen; merging them at scale is a more-complicated problem. But others have worked on it: the Corona Atlas and Referencing System run by the Center for Advanced Spatial Technologies (CAST) at the University of Arkansas actually uses Corona imagery to assist in Middle East archaeology. They run an atlas that lets you explore the high-resolution imagery as though it were Google Maps. The imagery’s age is actually an asset for this purpose; urban and agricultural development throughout the Middle East in the last fifty years obscures some archaeological sites in modern satellite imagery. CAST has georeferenced many Corona images and makes the data available for noncommercial use. The GAIA lab at UCSD also makes georeferenced imagery available as part of their Digital Archaeological Atlas of the Holy Land.
Posted in Geo | Comments Off on Using Declassified Spy Satellite Photos to Enhance the Resolution of Bible Maps
This year social networking topped the list, as it did last year, followed by alcohol, Twitter, chocolate, and, ironically, Lent. Swearing fell to #7 this year from #5 last year. With the absence of a major political or social event, 2019 was a fairly typical year for what people said they would give up for Lent.
This year, 44,291 tweets (excluding retweets) specifically mentioned giving up something, up from last year’s 29,609. In all, this year’s analysis covers 491,069 tweets, up from 427,810 last year.
Plastic
Giving up plastic has become increasingly popular in the past two years. In all, 464 tweets this year mentioned plastic of some sort, which would almost bring it into the top ten.
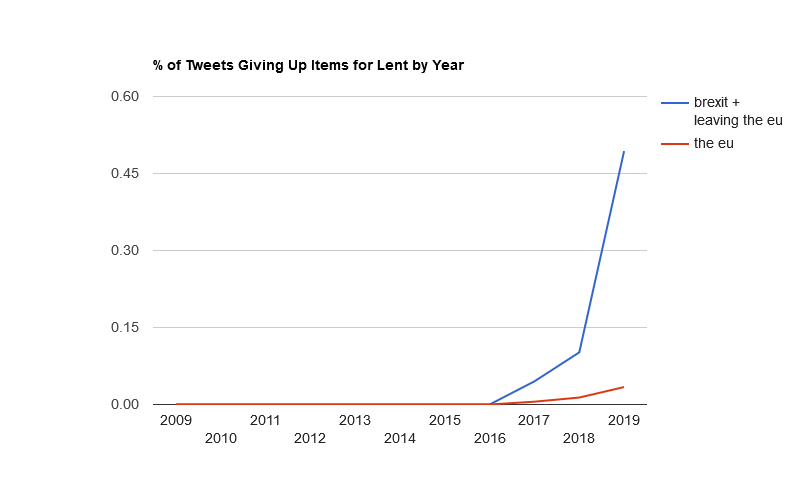
Brexit
The one major political event occurring over Ash Wednesday involved the ongoing Brexit debate. When British Prime Minister Theresa May accepted a suggestion that British lawmakers give up the EU for Lent, it led others to tweet the opposite:
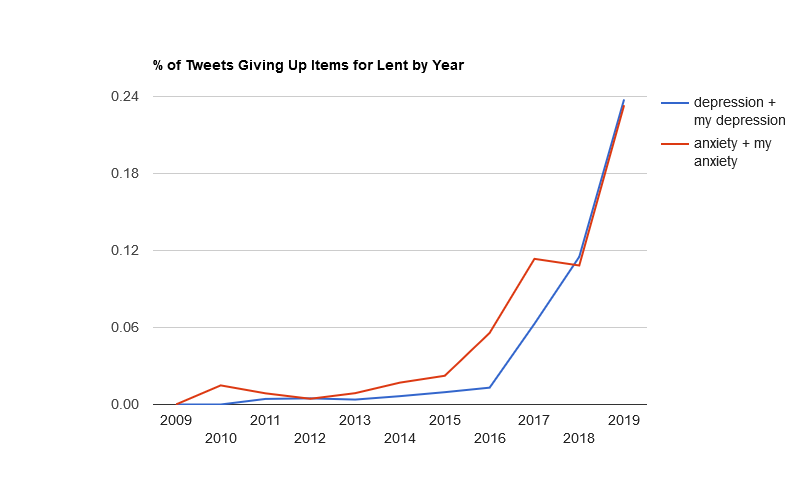
Depression and Anxiety
It was a banner year for those who said they were giving up both:
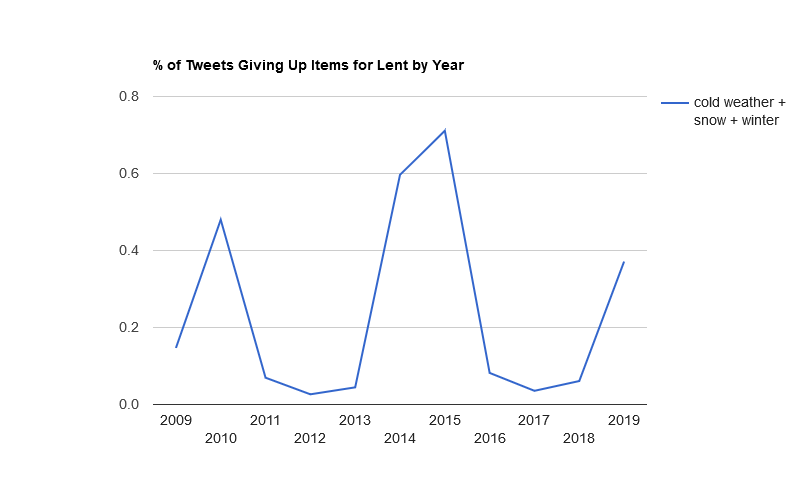
Winter
Tweets about cold weather were up this year, as they are cyclically depending on the severity of winter weather:
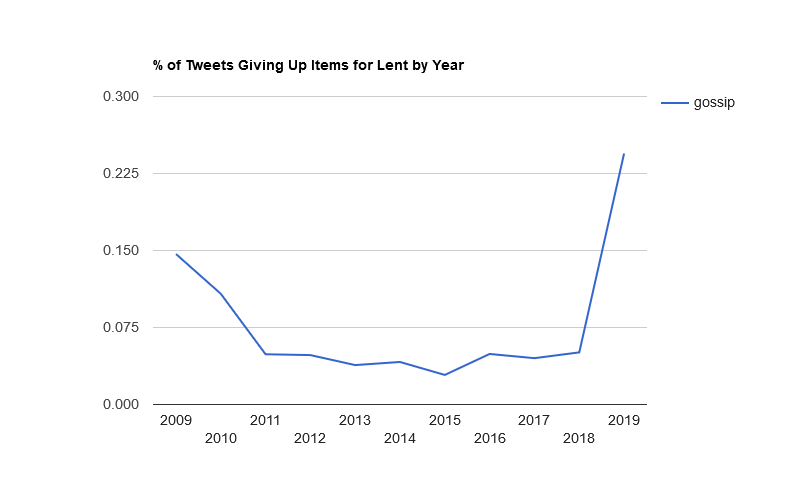
Gossip
Pope Francis this year suggested giving up gossip for Lent, leading to an increase in the number of tweets about it:
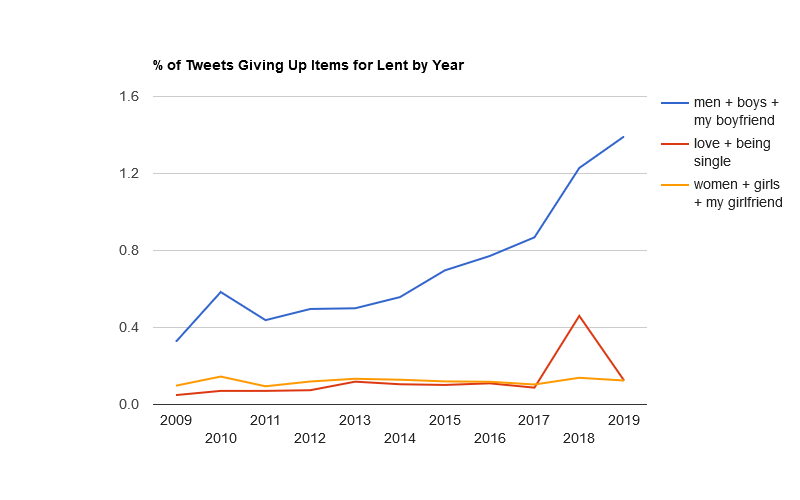
Relationships
Even though last year Ash Wednesday fell on Valentine’s Day, this year the percentage of people saying they were going to give up a significant other rose:
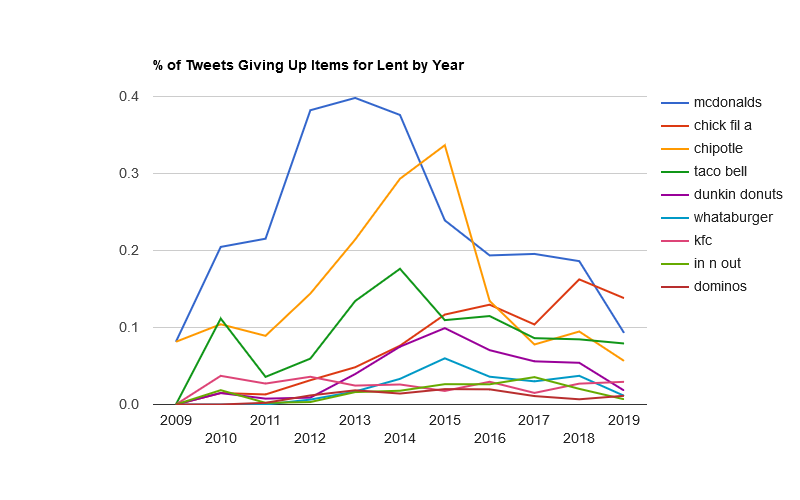
Fast Food
Chick-fil-A finally surpassed McDonald’s this year, and Chipotle continues its decline:
As I write this post, with about 1,500 tweets analyzed, perennial favorites “social networking,” “alcohol,” and “twitter” lead the list. If I had to guess, with an unusually cold February across much of the U.S., weather might feature more prominently this year than last year, when Ash Wednesday coincided with Valentine’s Day.
Look for the usual post-mortem on March 10, 2019.
Posted in Lent | Comments Off on Track in Real Time What People Are Giving Up for Lent in 2019
In a previous post, I discussed how 3D software could improve the resolution of Bible maps by fractally enhancing a digital elevation model and then synthetically creating landcover. In this post I’ll look at how machine learning can increase the resolution of freely available satellite images to generate realistic-looking historical maps.
Acquiring satellite imagery
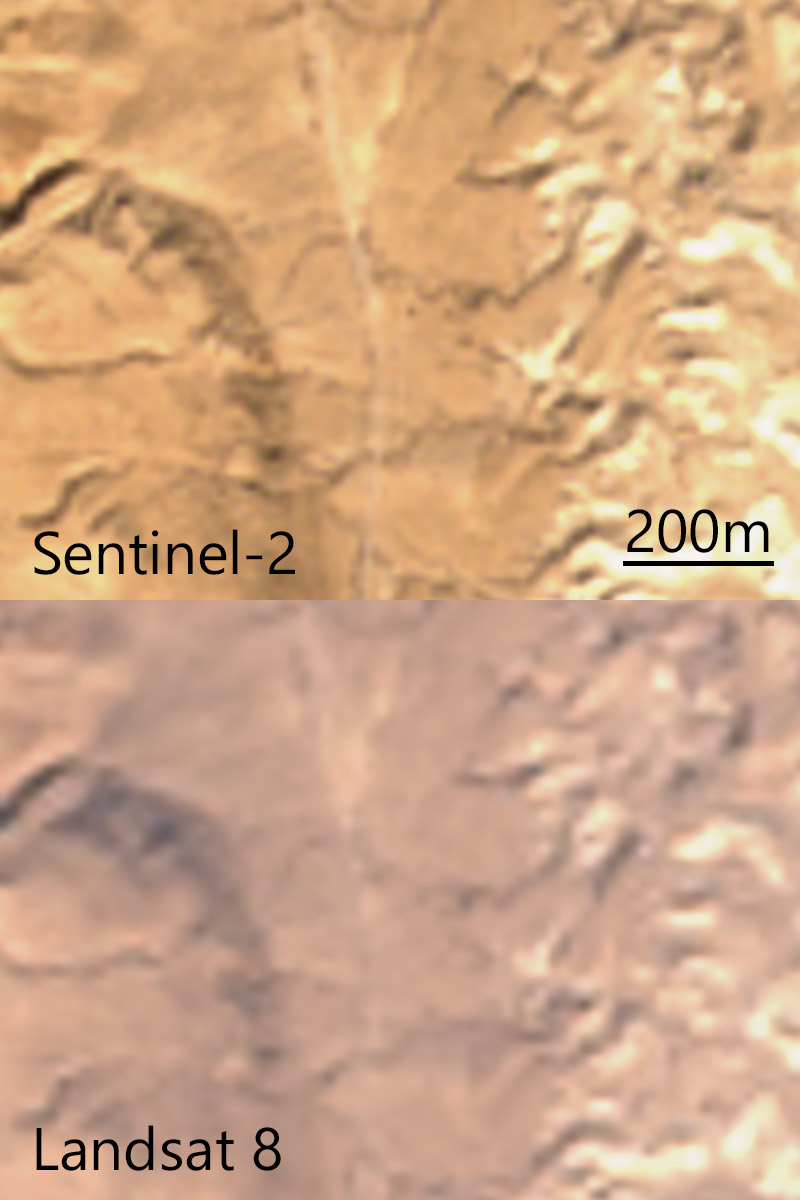
The European Sentinel-2 satellites take daily photos of much of the earth at a ten-meter optical resolution (i.e., one pixel represents a ten-meter square on the ground). The U.S. operates a similar system, Landsat 8, with a fifteen-meter resolution. Commercial vendors offer much higher-resolution imagery, similar to what you find in Google Maps, at a prohibitive cost (thousands of dollars). By contrast, both Sentinel-2 and Landsat are government-operated and have freely available imagery. Here’s a comparison of thetwo, zoomed in to level 16 (1.3 meters per pixel), or well above their actual resolution:
The Sentinel-2 imagery looks sharper thanks to its higher resolution, though the processing to correct the color overexposes the light areas, in my opinion. Because I want to start with the sharpest imagery, for this post I’ll use Sentinel-2.
I use Sentinel Playground to find a scene that doesn’t have a lot of clouds and then download the L2A, or atmosphere- and color-corrected, imagery. If I were producing a large-scale map that involved stitching together multiple photos, I’d use something like Sen2Agri to create a mosaic of many images, or a “basemap” (as in Google Maps). (Doing so is complicated and beyond the scope of this post.)
I choose a fourteen-kilometer-wide scene from January 2018 showing a mix of developed and undeveloped land near the northwest corner of the Dead Sea at a resolution of ten meters per pixel. I lower the gamma to 0.5 so that the colors approximately match the colors in Google Maps to allow for easier comparisons.
Increasing resolution
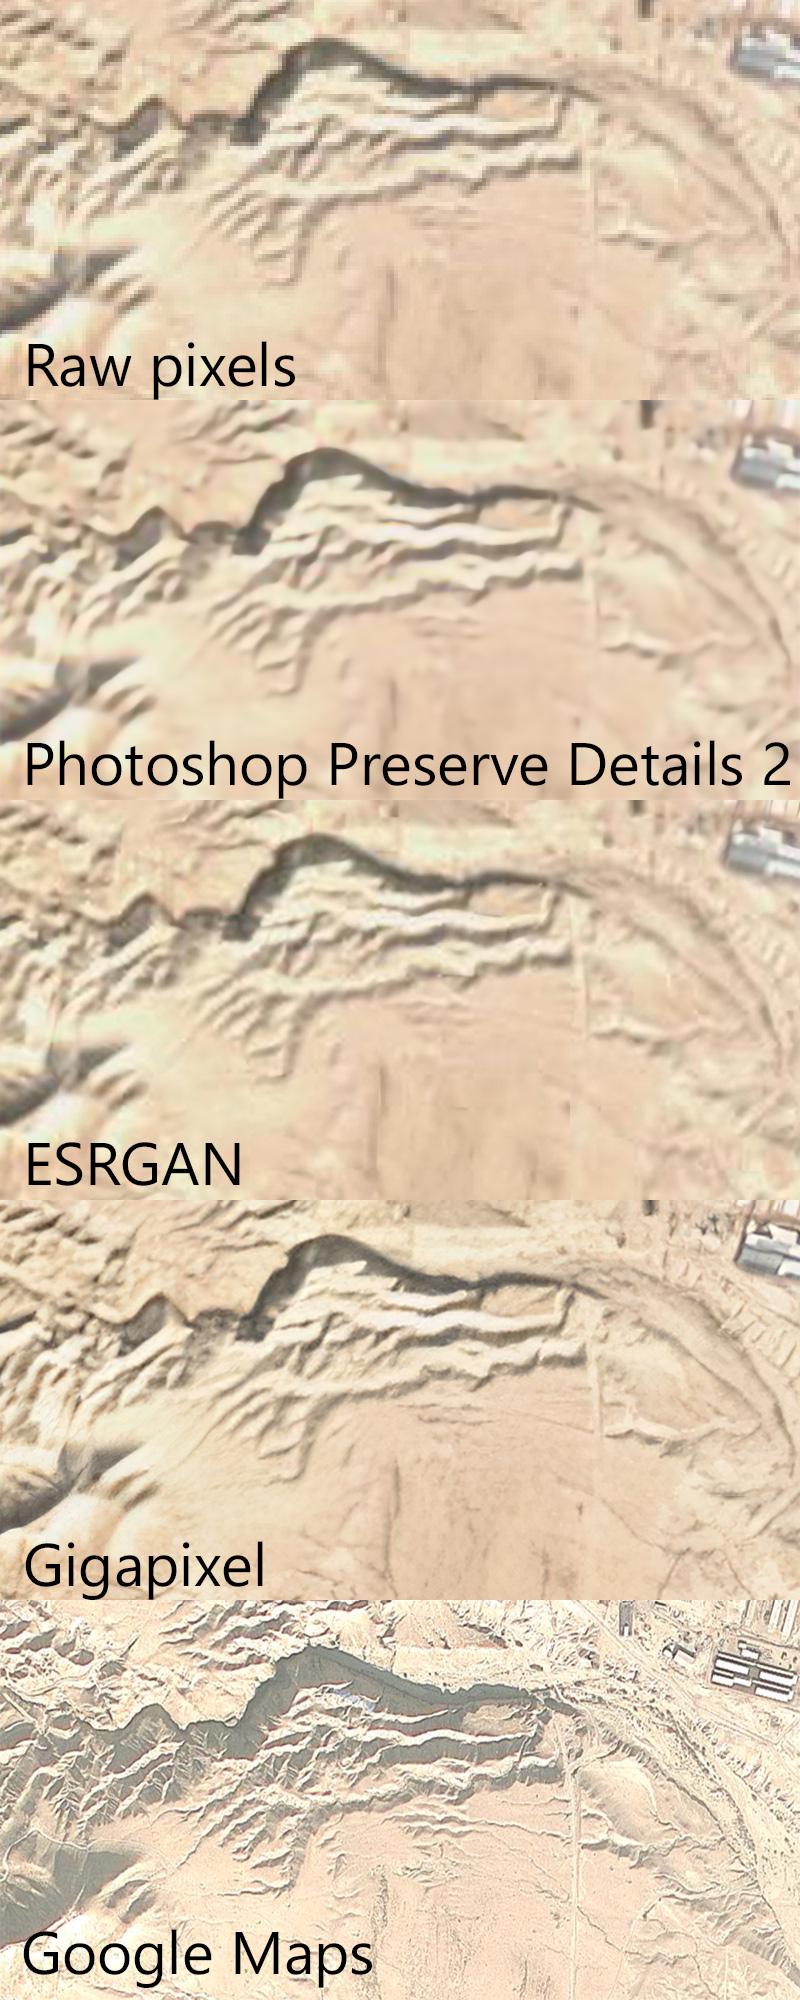
“Enhance!” is a staple of crime dramas, where a technician magically increases the resolution of a photo to provide crucial evidence needed by the plot. Super-resolution doesn’t work as well in reality as it does in fiction, but machine learning algorithms have increased in their sophistication in the past two years, and I thought it would be worth seeing how they performed on satellite photos. Here’s a detail of the above image, as enlarged by four different algorithms, plus Google Maps as the “ground truth.”
Each algorithm increases the original resolution by four times, providing a theoretical resolution of 2.5 meters per pixel.
The first, “raw pixels,” is the simplest; each pixel in the original image now occupies sixteen pixels (4×4). It was instantaneous to produce.
The second, “Photoshop Preserve Details 2.0,” uses the machine-learning algorithm built into recent versions of Photoshop. This algorithm took a few seconds to run. Generated image (1 MB).
The third, ESRGAN as implemented in Runway, reflects a state-of-the-art super-resolution algorithm for photos, though it’s not optimized for satellite imagery. This algorithm took about a minute to run on a “cloud GPU.” Generated image (1 MB).
The fourth, Gigapixel, uses a proprietary algorithm to sharpen photos; it also isn’t optimized for satellite imagery. This algorithm took about an hour to run on a CPU. Generated image (6 MB).
The fifth, Google Maps, reflects actual high-resolution (my guess is around 3.7 meters per pixel) photography.
Discussion
To my eye, the Gigapixel enlargement looks sharpest; it plausibly adds detail, though I don’t think anyone would mistake it for an actual 2.5-meter resolution satellite photo.
The stock ESRGAN enlargement doesn’t look quite as good to me; however, in my opinion, ESRGAN offers a lot of potential if tweaked. The algorithm already shows promise in upscaling video-game textures–a use the algorithm’s creators didn’t envision–and I think that taking the existing model developed by the researchers and training it further on satellite photos could produce higher-quality images.
One problem with using satellite photos as the base for historical maps involves dealing with modern features: agriculture, cities, roads, etc., that weren’t around in the same form in the time period the historical map is depicting. Machine learning presents a solution for this problem, as well; Photoshop’s content-aware fill allows you to select an area of an image for Photoshop to plausibly fill in with similar content. For example, here’s the Gigapixel-enlarged image with human-created features removed by content-aware fill:
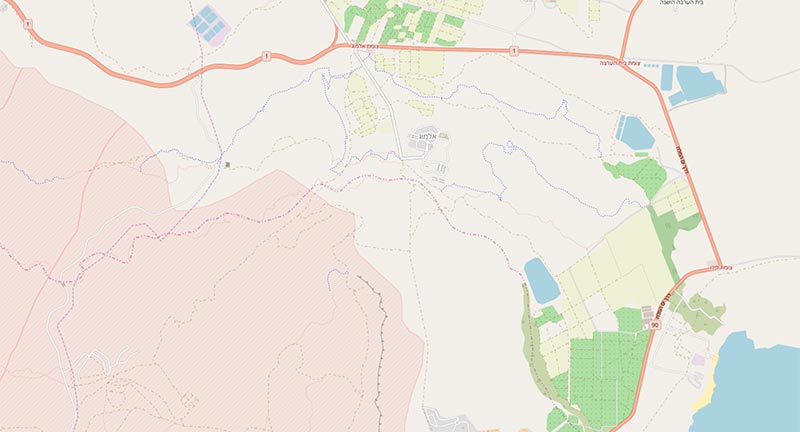
I made these edits by hand, but at scale you could use OpenStreetMap’s land-use data to mask candidate areas for content-aware replacement:
Conclusion
If you want to work with satellite imagery to produce a high-resolution basemap for historical or Bible maps, then using machine learning both to sharpen them and to remove modern features could be a viable, if time-consuming, process. The image in this post covers about 100 square kilometers; modern Israel is over 20,000 square kilometers. And this scene contains a mostly undeveloped area; large-scale cities are harder to erase with content-aware fill because there’s less surrounding wilderness for the algorithm to work with. But if you’re willing to put in the work, the result could be a free, plausibly realistic, reasonably detailed map over which you can overlay your own data.
If you’re reading this blog, then you’re probably interested in attending the BibleTech conference, held on April 11-12, 2019, in Seattle.
You may even be interested in submitting a proposal for a talk; if so, the deadline is January 31.
Here’s what I plan to talk about if they accept me:
Designing for Agency in Bible Study
This talk explores the theory and practice of designing a Bible study experience so that the distinctive property of digital media–interactivity at scale–enhances rather than constrains the participant’s agency, or ability to act. We’ll discuss how people’s psychological needs for competence, relatedness, and autonomy affect their approach to and expectations of the Bible and church life, and how developers can support these needs by considering agency during the design process. We’ll also look at a specific application that HarperCollins Christian Publishing has developed to put these ideas into practice and promote agency in the context of daily Bible reading, explaining how and why we transformed a product that wasn’t a good fit for print into one that feels digitally native.
Posted in Technology | Comments Off on BibleTech 2019
The problem with using satellite photos for Bible (or other historical) maps lies in their photographic nature–they present the world as it is, with modern cities, agriculture, land use, and other infrastructure that didn’t exist in the ancient period that the maps are depicting. However, satellite maps are useful in showing “true-color” views and revealing features like transitions from deserts to wetlands.
If you’re not using satellite photos for the Bible maps you’re creating, you’re using other data, like elevation; indeed, with only elevation data, you can produce a variety of map styles. Shaded relief shows hills in a naturalistic way, approximating the look of satellite images. A hypsometric map, where the map color changes with elevation, also depicts this data, though I would argue that hypsometric maps can be misleading if they transition from green colors at low elevations to brown colors at higher elevations, since people have become used to satellite photos with these colors as depicting land cover.
The main problem with relying on elevation data (a digital elevation model, or DEM) is its relatively low resolution; until 2015, a 90-meter resolution (i.e., one pixel of elevation data corresponds to an approximate square 90 meters by 90 meters) was the highest resolution freely available worldwide (well, mostly worldwide). In 2015, the SRTM worldwide elevation data became available at a 30-meter resolution, or 9 times higher resolution than previously. Also in 2015, similar ALOS 30-meter data became available. If you’re willing to pay tens or hundreds of thousands of dollars, you can also find proprietary elevation data at resolutions of 5 meters. Most of us aren’t in a position to pay that kind of money, however, so I’m interested in free data.
Bible atlases produced before 2015 almost certainly use the coarser 90-meter resolution, while Bible atlases produced since (though as of late 2018 I’m not aware of any) would likely use the 30-meter resolution and can zoom in much further without becoming blurry.
However, 30 meters feels rough compared to the satellite imagery available in Google Maps, which is often at 30 centimeters. Even free imagery from the European Sentinel-2 project is available at 10 meters, or 9 times higher resolution than 30 meters.
DEM Enhancements
The question I have is whether it’s possible to enhance a 30-meter DEM to bring it closer to the high resolution that Google Maps is training us to expect on maps everywhere.
To answer that question, I turned to Terragen, 3D modeling software designed to render photorealistic landscapes. (I actually tried several different programs, but Terragen was the least confusing.) Terragen and similar programs procedurally improve resolution by adding fractal enhancement–in other words, they extrapolate from the available data to add plausible, if fake, detail. My process was the following:
Find a high-resolution DEM to use as a reference for the output of the process.
Downsample the DEM to 30-meter resolution to match the DEM available worldwide.
Enhance and style the DEM in Terragen to mimic a satellite photo.
Compare the output.
The U.S. Geological Survey has started making elevation data available at a 1-meter resolution for select parts of the United States. I picked a desert area near Dayton, Nevada, that roughly matches the terrain of ancient Israel (since Israel will probably be the subject of most Bible maps).
I converted the USGS .img file into a geotiff using gdal_translate and resampled it to 30-meter resolution using gdalwarp -tr 30 30 USGS_NED_one_meter_x27y436_NV_Reno_Carson_QL2_2017_IMG_2018.img nv-30.tif.
The result was two tiffs that I imported into Terragen. After that, I spent some time coloring and styling them, with the below results:
This image shows 1-meter shaded relief, 30-meter shaded relief with blurry bicubic resampling, 10-meter publicly available satellite photo that I slightly retouched, 1-meter colored and enhanced in Terragen, 30-meter colored and enhanced in Terragen, and the Google Maps view for this area.
I feel like the 30-meter Terragen view, which is what you could plausibly produce for Bible maps, looks pretty OK, actually–though a trained 3D artist would do better. The 1-meter data, while accurate, reproduces modern features like the road on the right side, which is unhelpful for Bible maps–mitigating modern features is the one of the main points of this exercise. While the 30-meter view doesn’t have all the detail of the 1-meter version, the rendering feels plausible to me.
Of course, “plausible” doesn’t mean “accurate,” and there’s the question of whether it’s ethical to enhance terrain in this way–you’re essentially inventing detail that doesn’t exist in the source data, which could mislead someone if they believe that the detail reflects reality. It depends how far you want to push the idea that all maps are in some way plausible fictions.
Scaling Up
What’s needed to implement this technique in production?
A base map to use for coloring (I’d use Natural Earth II–I tried it in the Nevada scene and think it could work–but you could also use satellite imagery or your own colors).
A way to export and reproject the finished product. My free version of Terragen can only export images 800 pixels wide; you’ll probably want to export them at over 10,000 pixels wide. And then you’ll need to stitch them together and reproject them to Web Mercator to display them in online mapping applications.
A way to layer the images with other data (such as bodies of water and labels).
A delivery mechanism (probably tiles over the Internet, as with Google Maps and most mapping applications).
Conclusion
This approach represents a plausible way to improve the resolution of Bible maps or other historical maps using only publicly available, free data. Although it creates some ethical problems, with proper disclosure it could potentially be a useful way to make Bible maps more compelling and zoomable.


