Google’s NotebookLM has a new feature that turns anything you upload into a podcast conversation between two synthetic hosts. Ben Cohen in today’s Wall Street Journal says that it’ll “blow your mind,” and he’s right.
Here’s a conversation about the book of Galatians—all I did was give it a link to Bible Gateway, and it produced this fifteen-minute conversation:
This is, honestly, good. It has what I’d look for in an non-technical overview of Galatians, and it’s more-engaging to listen to than the typical sermon. It doesn’t go too in-depth, but it’s a strong overview.
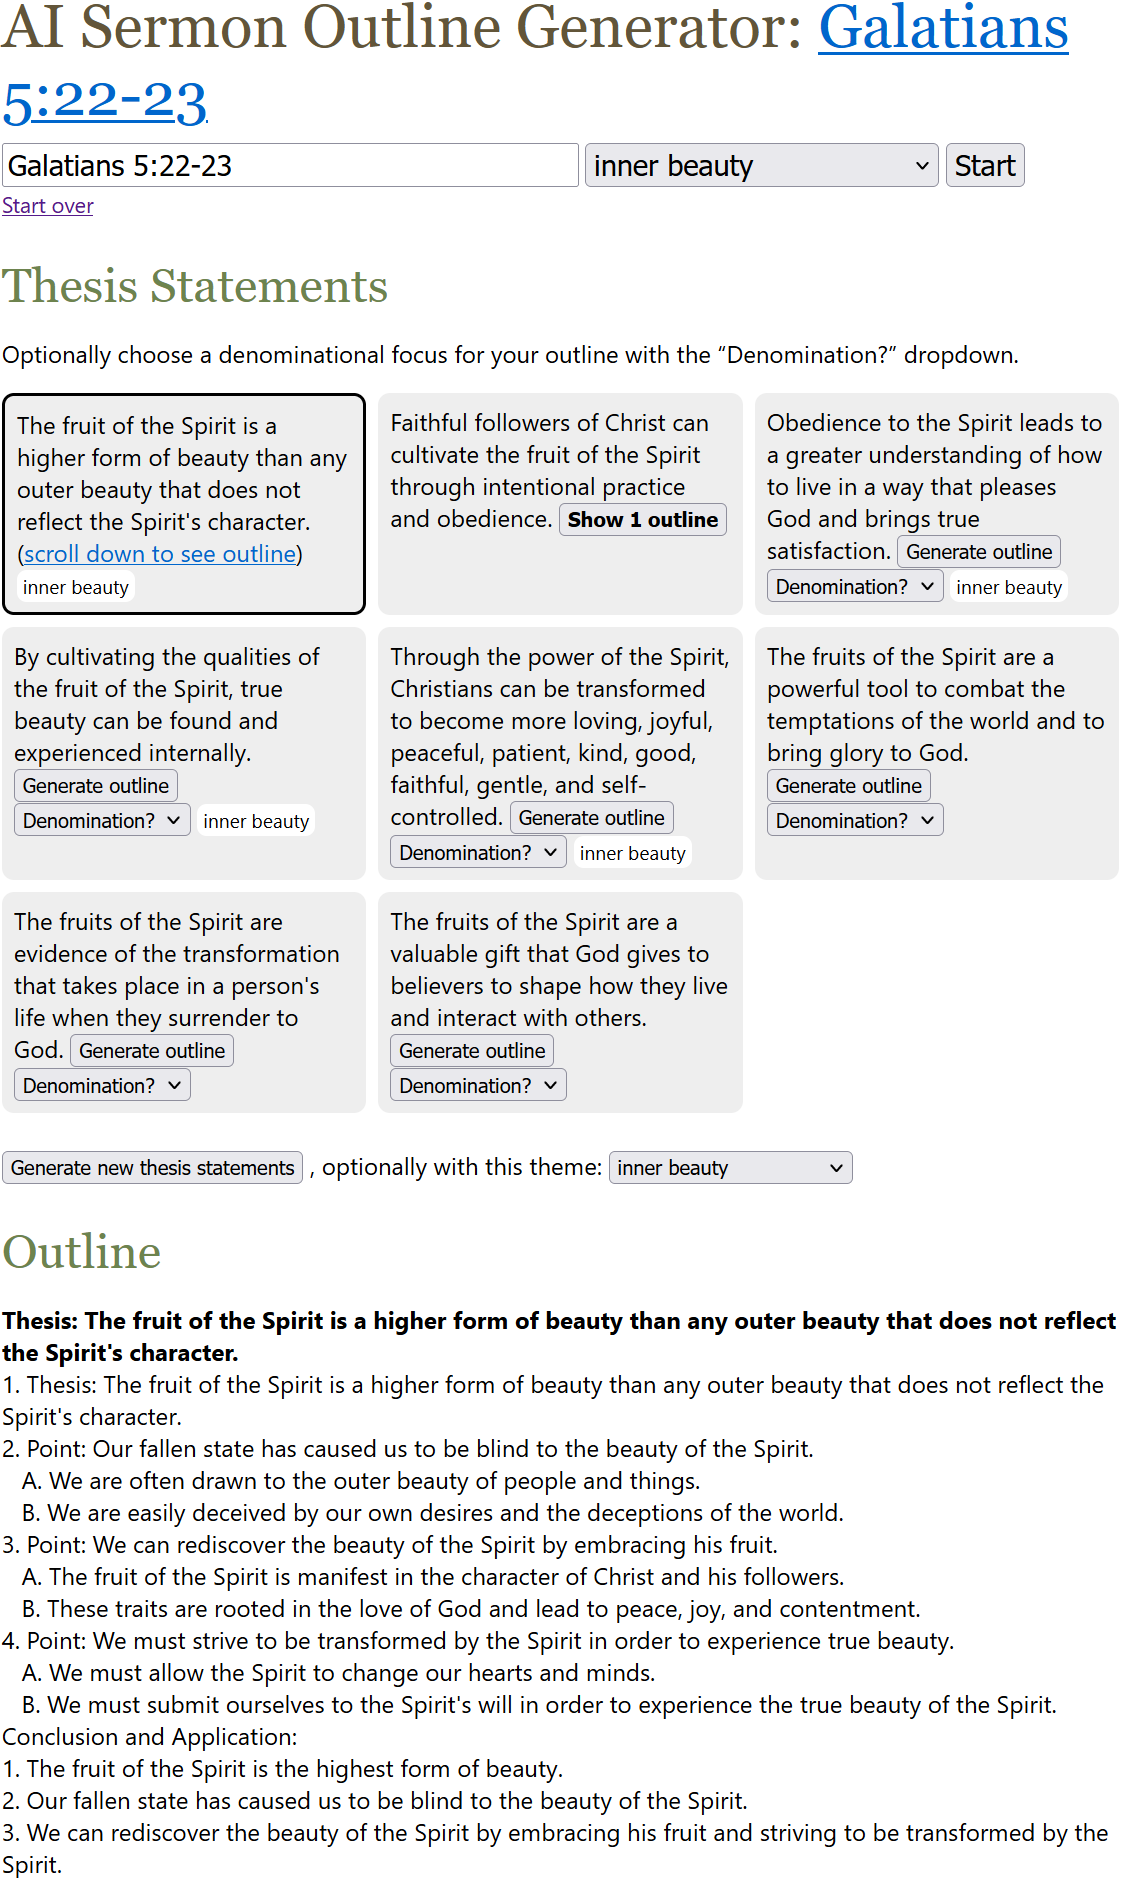
In my intro to the AI Sermon Outline Generator, I said that the sermon outlines it generates are “around the 50th percentile” in terms of sermon quality, but I’d put this podcast closer to the 90th percentile, at least in terms of presentation. It’s engaging—very much like a natural conversation between two people who are discussing the text while bringing in perspectives and background information. It even includes personal application (a takeaway) the way a sermon would.
Listening to this discussion was ear-opening for me: it was better than nearly every sermon I’ve ever heard, but its insights are synthetic and not really aimed at me (or anyone). I didn’t hear anything that was wrong, but as with any AI, it could very easily make things up, misinterpret passages, or introduce subtle (or not-so-subtle) heresies. But it’s so engaging that I might not even notice.
Elisha and the Bears
Next, I gave it the difficult story of Elisha and the bears from 2 Kings 2:23-25:
Here it did a decent job of presenting some of the basic interpretive options, but I wouldn’t say it engaged that much with the text. It also didn’t really draw conclusions.
So I uploaded about 3,000 words of commentary material on this passage, and it produced the following:
This is definitely better, and it grounds it in more of the commentary text. Again its conclusion is that you need to figure out its meaning for yourself, which isn’t exactly what I’m looking for in a sermon. But it still did a good job of presenting background info and various interpretations.
Your Daily Bible Reading
Lastly, I uploaded today’s Daily Office reading; the Daily Office thematically arranges texts, so I expected it to draw out similarities between them. It didn’t disappoint:
I grant you, again, that it isn’t the deepest conversation. But it hit the themes and key verses in an engaging way; it did a good job providing thoughts around the text and making me care more about what I just read in the Bible. And, importantly, I could produce a similar podcast no matter what my passages were; it’s custom-generated for exactly what I’m reading.
What’s Are These Podcasts Useful For?
Because the podcasts are stylistically engaging, I think it might make sense for a pastor to upload a sermon’s Bible passages along with research materials into NotebookLM and have it generate a podcast about it. You can listen to it while you’re going for a walk or commuting somewhere. Then you can ask yourself questions like: What does the podcast focus on? How does it activate interest and curiosity in listeners the way podcasts do? The risk is that it’ll podcastify your sermon and move it toward becoming a podcast rather than a sermon. But if you struggle with sermon writing, it might give you some ideas on engaging your audience.
As for non-pastors, creating a podcast that directly relates to your regular Bible reading might be a way to help you think about the Bible text in a new way. It’s worth trying out if you find that you’re looking for something different.
Do They Make Sermons Obsolete?
I wouldn’t say that these podcasts make sermons obsolete, exactly, since they don’t serve the same purpose as a sermon. In terms of quality and keeping my interest, these podcasts surpass most sermons I’ve heard. In terms of depth and insight, they tend to pose questions more than provide answers, which is fine for the podcast genre but isn’t necessarily what I’m looking for in a sermon.
But I was still impressed: as custom, near-instant podcasts, they work really well—much better than I was expecting. Outside of church, I’m much more likely to listen to one of these podcasts than I am to a sermon, especially since I can ensure the podcast will cover exactly the topic I’m interested in and ground it in the sources I care about.